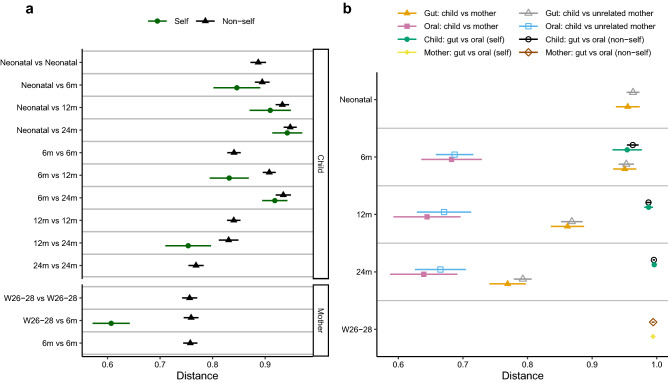
Figure 3.
Comparison of microbiota composition based on Bray–Curtis distances. The shorter the distance between any pair of comparisons indicate greater similarity between microbial communities collected at those times. W gestational week and m month. Symbols represent means and error bars 95% confidence intervals. (a) Comparisons of gut microbiota at different sampling times, where distances between different sampling points within the same child/mother (self), and distances between unrelated children (non-self) and between unrelated mothers (non-self) are denoted. (b) Comparisons between gut and oral microbiota, and between children and their mothers and unrelated mothers. The distance between child and mother is based on the maternal sample at gestational week 26–28.

