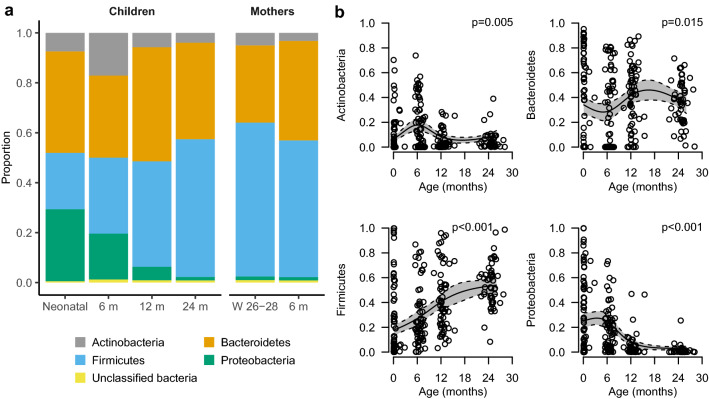
Figure 4.
Bacterial phyla present in at least 75% of the faecal samples. a Stacked bar charts of the relative distribution of phyla detected in the gut at different time points. (b) Model-based predictions of relative abundance of phyla in the gut of children plotted against age. Lines indicate mean values (solid) and 95% confidence intervals (dashed). The y-axis shows the relative abundance in proportion. The predictions are shown from the 10th to the 90th percentile of age. W gestational week and m month.

