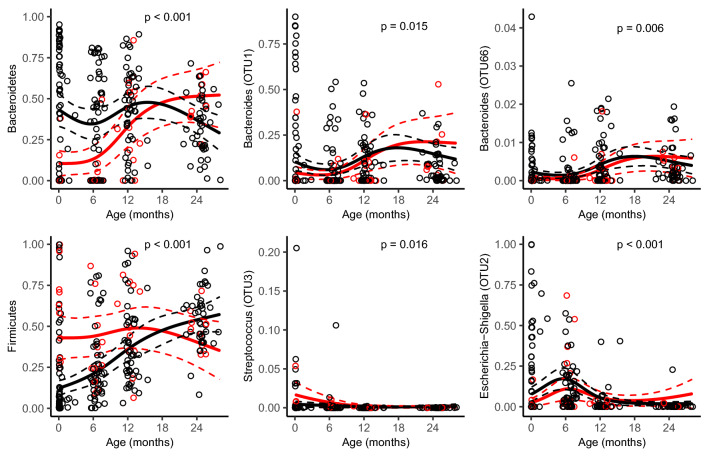
Figure 5.
Model-based predictions of relative abundance in bacterial phyla and specific operational taxonomic units (OTUs) in the gut microbiota by mode of delivery plotted against age. Lines indicate mean values (solid) and 95% confidence intervals (dashed), adjusted for potential confounders (see Table 1). P reflect for the interaction between mode of delivery and child age. All continuous adjustment variables are fixed at their median value and all categorical adjustment variables are fixed at their most common category.

