
Fig. 2. The distribution (box and whisker plots) of responses, by vaccine type and adoption rate, to the question “Suppose the [conventional/RNA] Covid-19 vaccine is endorsed by your Government, free, [but no one/and 20%/and 40%/and 60%/and 80% of people] in your country [has/have] received the vaccine. How likely are you to accept the vaccination?”.
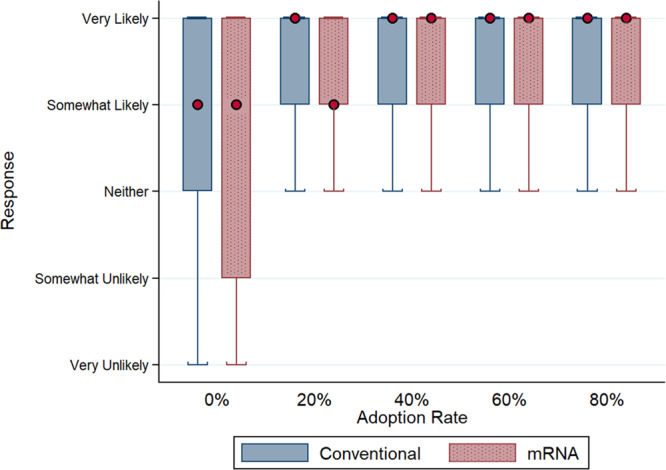
Boxes indicate median and interquartile range (IQR) with the red dot specifying median value, and whiskers indicate range (data within 1.5*IQR). Conventional vaccine n = 17,527 responses (0% adoption rate n = 3,488 responses, 20% n = 3,551 responses, 40% n = 3,620 responses, 60% n = 3,488 responses, 80% n = 3,380 responses); mRNA vaccine n = 17,646 responses (0% adoption rate n = 3,548 responses, 20% n = 3,648 responses, 40% n = 3,520 responses, 60% n = 3,514 responses, 80% n = 3,416 responses). The source dataset for the figure can be found in Supplementary Data 1.