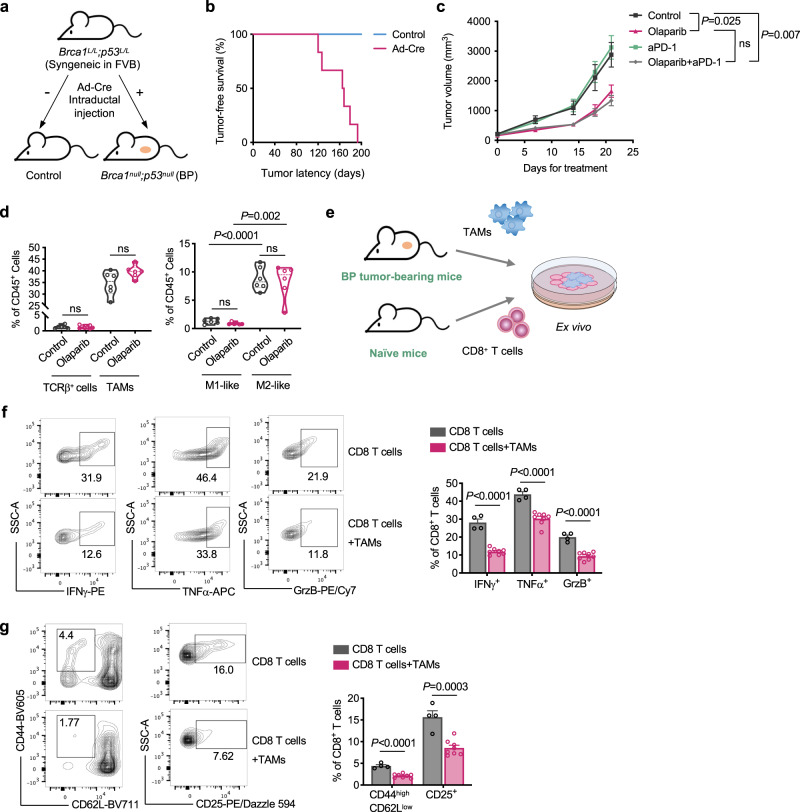
Fig. 1. Brca1-deficient breast tumors have a modest response to olaparib in vivo with immune-suppressive TAMs.
a Generation of a syngeneic GEMM of Brca1-deficient breast tumors by intraductal injection of adenovirus expressing Cre recombinase (Ad-Cre) directly into the lumen of mammary glands. b Tumor-free survival of Brca1L/L Trp53L/L mice with or without intraductal injection of Ad-Cre (n = 6). c Tumor growth of Brca1−/− Trp53−/− (BP) allografts in FVB mice treated with olaparib or anti-PD-1 as monotherapy or in combination. Control, n = 8; anti-PD-1, n = 8; olaparib, n = 6; olaparib + anti-PD-1, n = 10. d Flow cytometry analysis of TCRβ+ T cells and tumor-associated macrophages (TAMs; CD45+ CD11b+ F4/80+) from BP tumors in FVB mice after 21 days of olaparib treatment. TCRβ+ (control), n = 6; TCRβ+ (olaparib), n = 8; TAMs (control), n = 6; TAMs (olaparib), n = 6. TAMs were further analyzed to identify M1-like (MHC-IIhigh CD206−) and M2-like (MHC-IIlow CD206+) polarization phenotypes (n = 6 for each group). Each dot represents data from a single tumor. e Diagram of workflow for (f) and (g). TAMs (7AAD− CD45+ CD11b+ F4/80+) were sorted from BP breast tumors and co-cultured with splenic CD8+ T cells isolated from naïve mice for 2 days. f Analysis of cytokine production by CD8+ T cells co-cultured with TAMs (CD8+ T cells, n = 4; CD8+ T cells+TAMs, n = 8). g Analysis of the proportion of effector cells (CD44high CD62Llow) and surface expression of CD25 of CD8+ T cells co-cultured with TAMs (CD8+ T cells, n = 4; CD8+ T cells+TAMs, n = 8). Flow cytometry plot axes are displayed in logarithmic scale (f) and (g). Data are presented as mean ± SEM (c), (f), and (g), or median with quartiles (violin plots, d). Two-way analysis of variance (ANOVA) (c). Two-tailed unpaired t test or Mann–Whitney test (d), (f), and (g). ns not significant. Source data are provided as a Source Data file.

