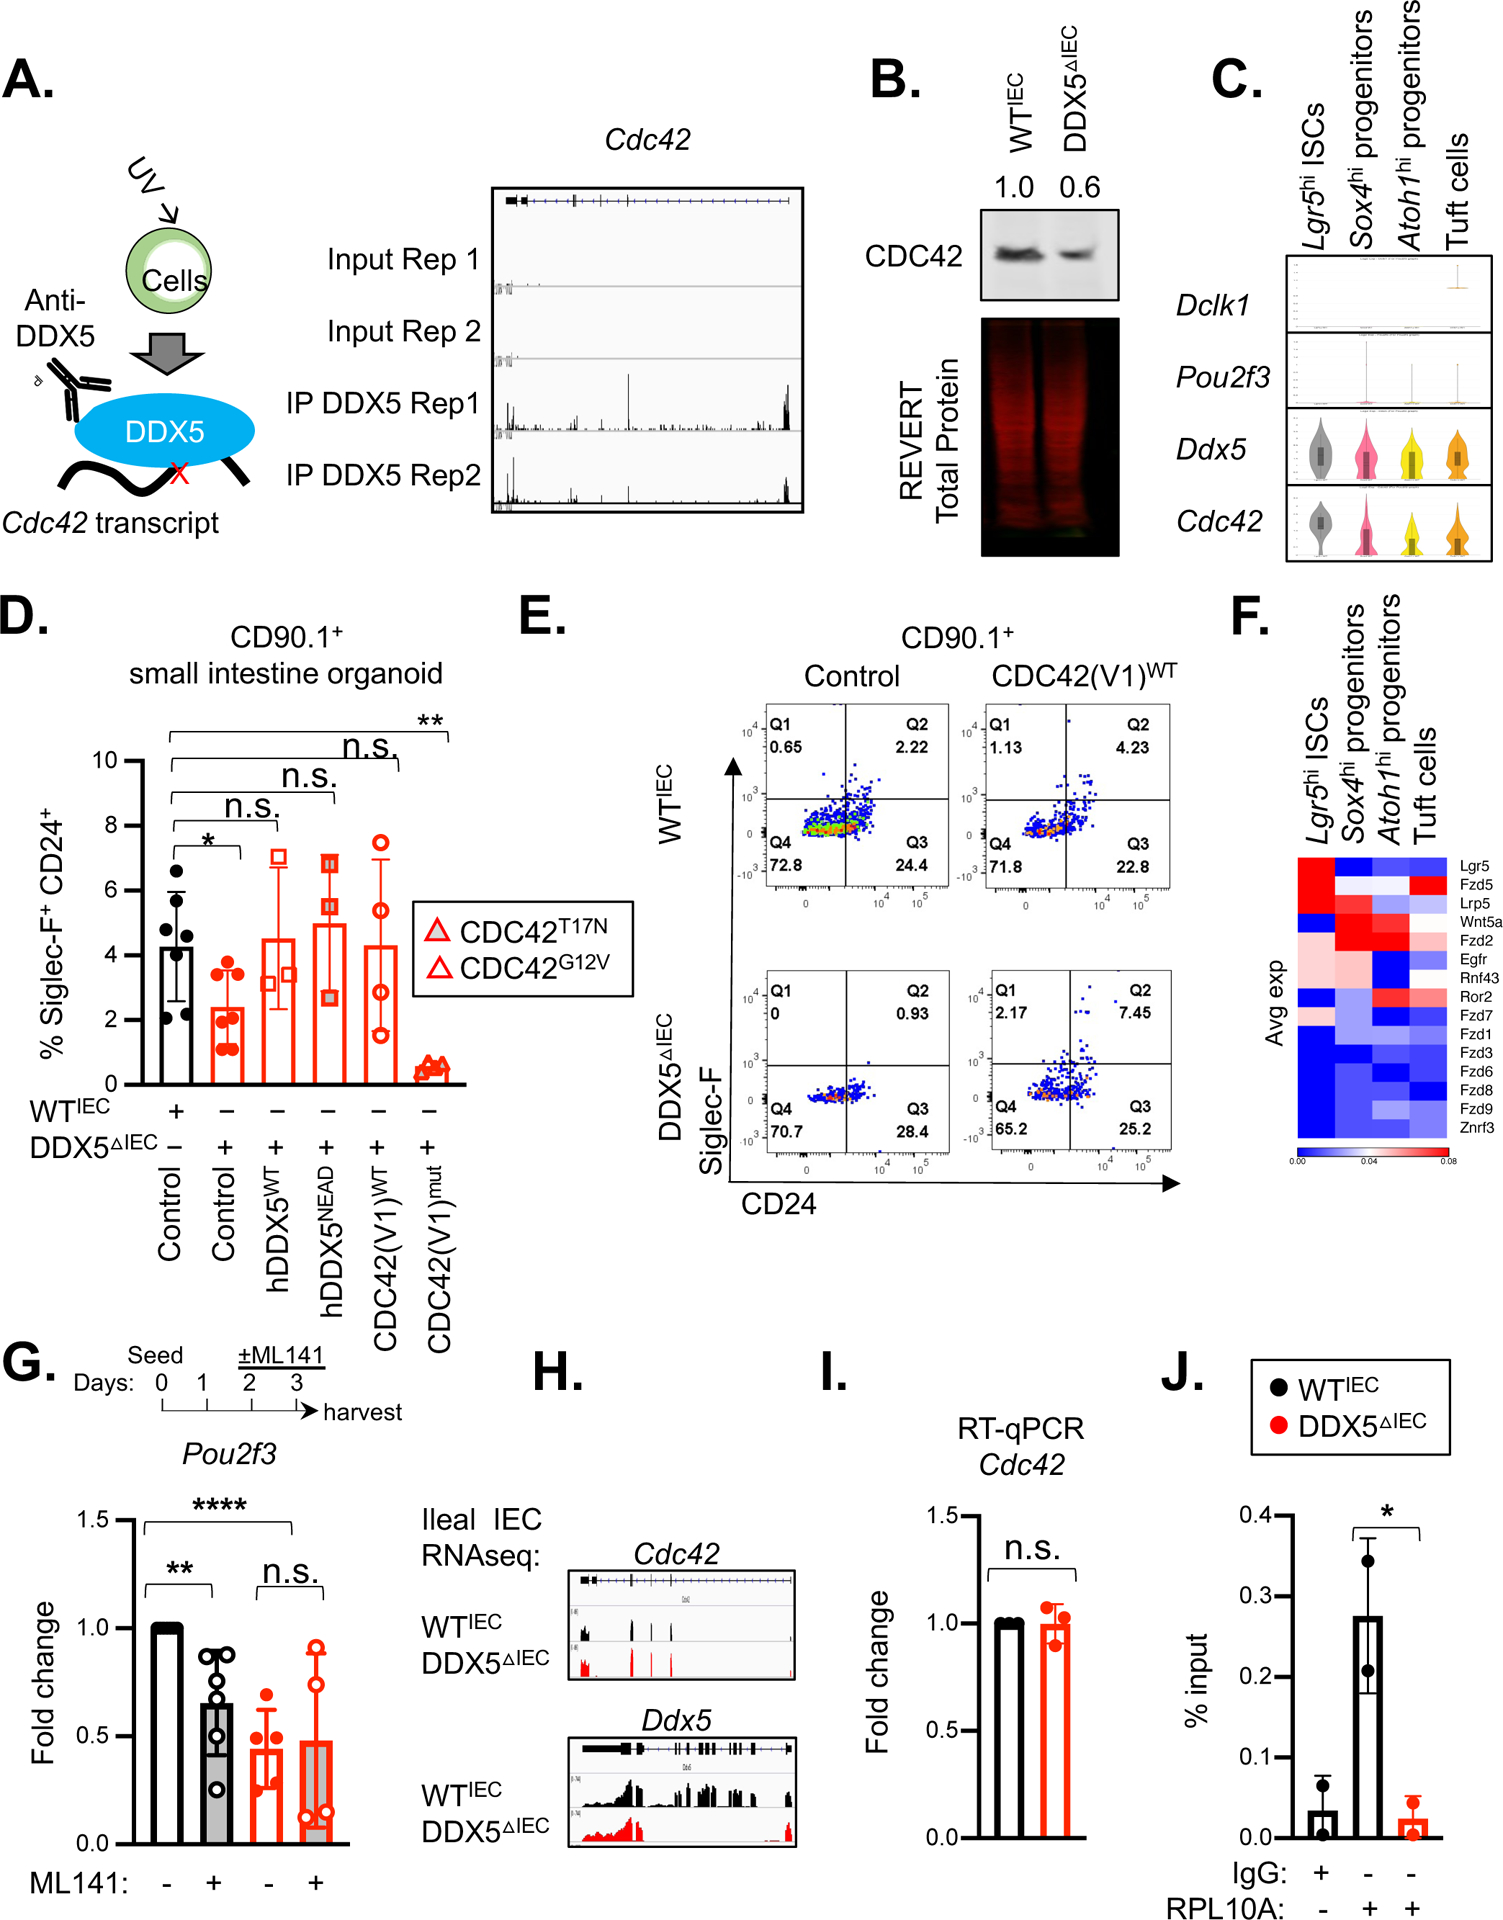
Figure 3. DDX5 regulates Pou2f3 expression and tuft cell specification by promoting Cdc42 translation.

A. Left: Schematic representation of the enhanced CLIP (eCLIPseq) experiment. Right: Integrative Genomics Viewer (IGV) browser view of DDX5 eCLIPseq signals at the Cdc42 loci from two independent experiments.
B. Representative western blot for CDC42 in whole cell lysates of small intestinal IECs from WTIEC and DDX5ΔIEC mice. Experiments were repeated three times using independent biological samples with similar results.
C. Violin plots displaying expression of Dclk1, Pou2f3, Ddx5, and Cdc42 in small intestinal stem cells (ISC, Lgr5hi), Atoh1hi and Sox4hi secretory lineage progenitors, or tuft cells from the spatial transcriptomics dataset described in Figure 2A.
D. Summary of the % of SiglecF+CD24+ tuft cells in WTIEC and DDX5ΔIEC small intestinal organoids 7 days post-transduction with retrovirus (marked by CD90.1+) carrying the indicated expression vectors. Each dot represents the result from an independent organoid experiment. n.s. not significant, * p<0.05, ** p<0.01 (unpaired t-test).
E. Representative flow cytometry plots from D.
F. Heatmap indicating the average expression of known signaling molecules upstream of CDC42 activation in ISCs, progenitors, and tuft cells from Figure 2A.
G. Fold change of Pou2f3 mRNA in WTIEC (n=6) or DDX5ΔIEC (n=5) small intestine organoids cultured in the presence of CDC42 inhibitor ML141 (10μM) for 24 hours relative to WTIEC cells treated with vehicle control (DMSO). Each dot represents the result from one mouse. n.s. not significant, ** p<0.01, **** p<0.001 (unpaired t-test).
H. IGV browser view of WTIEC and DDX5ΔIEC ileal IEC RNAseq-derived sample reads mapped to the Ddx5 and Cdc42 loci (GSE123881).
I. Fold change of ileal Cdc42 mRNA in DDX5ΔIEC mice (n=3) relative to values found in WTIEC mice (n=3). Each dot represents the result from one mouse. n.s. not significant (unpaired t-test).
J. Ribosome RPL10A enrichment from Cdc42 mRNA in small intestinal IECs. Results shown represent the average of two independent experiments. Each dot represents the result from one mouse. * p<0.05 (unpaired t-test).
