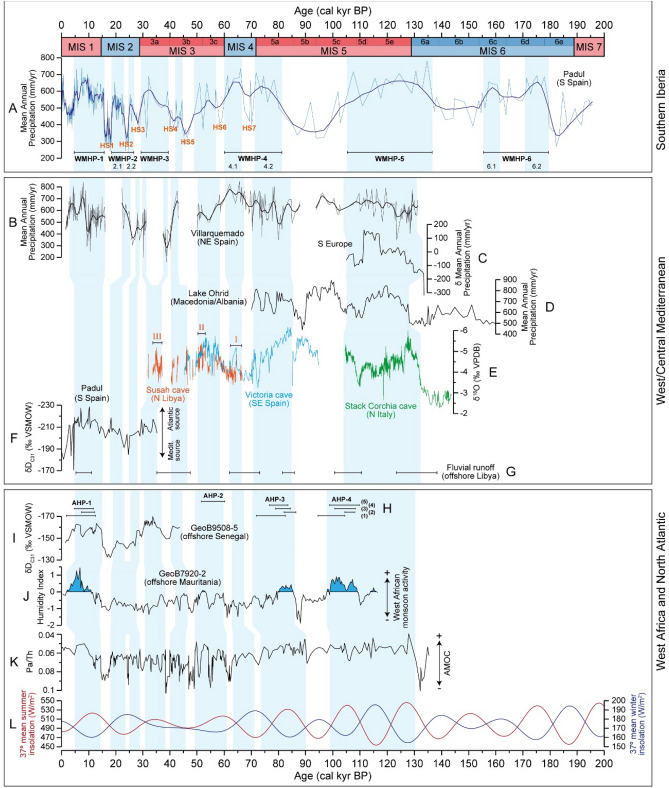
Figure 4.
Comparison of the Padul MAP reconstruction with other multiproxy records for the last 200 kyr BP. Top panel (southern Iberia): (A) Reconstructed Padul MAP (mm/yr) along with the WMHPs (black horizontal lines) and HSs. Middle panel (other West/Central Mediterranean records): (B) our Villarquemado MAP reconstruction (mm/yr) (NE Spain), (C) Average MAP change (mm/yr) for southern Europe40, (D) MAP reconstruction from Lake Ohrid (Macedonia/Albania)11, (E) δ18O from Susah cave (N Libya)2,46, Victoria cave (SE Spain)45 and Corchia cave (N Italy)41–44 (note inverted scale), (F) δDC31 from Padul31 (note inverted scale), (G) fluvial runoff pulses from the 64PE349-8 record (offshore Libya)47. Bottom panel (West Africa, North Atlantic and insolation): (H) age-ranges of African Humid Periods (black horizontal lines) identified by different studies: (1) Ehrmann et al.96, (2) Grant et al.97, (3) Skonieczny et al.98, (4) Ziegler et al.99 and Pausata et al.48, and (5) Kinsley et al.100, (I) δDC31 from the GeoB9508-5 record (continental slope off Senegal)51 (note inverted scale), (J) Humidity index from the GeoB7920-2 record (offshore Mauritania)58, (K) Pa/Th from the North Atlantic CDH19 record61 (note inverted scale), (L) 37°N mean summer and winter insolation.

