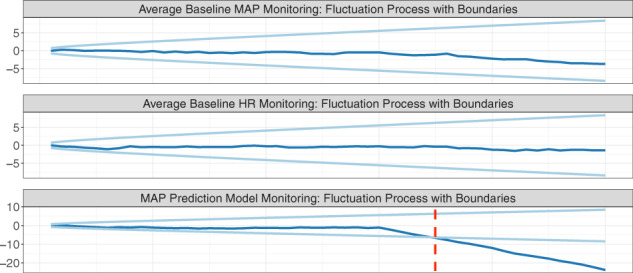
Fig. 3. Continual monitoring of a hypothetical AI algorithm for forecasting mean arterial pressure (MAP).

Consider a hypothetical MAP prediction algorithm that predicts a patient’s risk of developing an acute hypotensive episode based on two input variables: baseline MAP and heart rate (HR). The top two rows monitors changes in the two input variables using the CUSUM procedure, where the dark line is the chart statistic and the light lines are the control limits. The third row aims to detect changes in the conditional relationship between the outcome and input variables by monitoring the residuals using the CUSUM procedure. An alarm is fired when a chart statistic exceeds its control limits.
