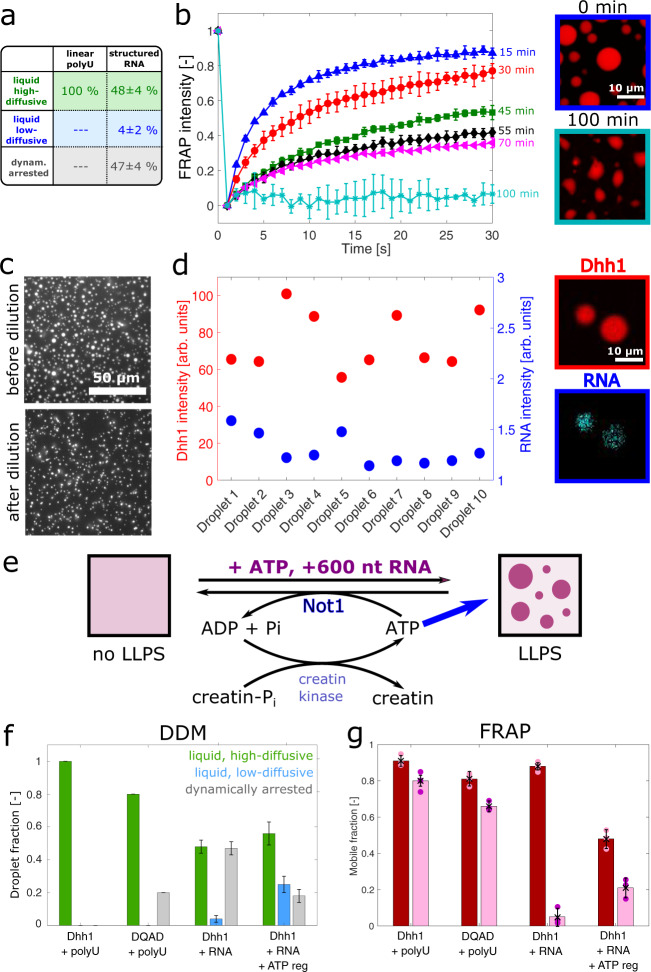
Fig. 6. Effect of structured RNA on the dynamics of the condensates.
a The addition of 0.05 mg/ml structured RNA (600 nucleotides) to a solution of 11 µM full-length Dhh1 and 5 mM ATP/MgCl2 lead to the formation of droplets with a high fraction (47 ± 4%) of glass-/gel-like droplets, in contrast with droplets formed in presence of polyU (0%). b Fluorescence recovery after photobleaching (FRAP) measurements showed a decrease in the mean recovery of three different droplets over a time course of 100 min. Simultaneously, the morphology of the droplets changed from an initially spherical to an irregular shape. Error bars represent the standard deviation of FRAP signals of three different droplets. c Condensates formed in presence of structural RNA cannot be dissolved by dilution. d Different droplets imaged by using confocal microscopy at the same time point exhibited different values of mCherry-tagged Dhh1 and Fluorescein-12-labeled RNA intensities. Intensity values represent the whole droplet mean intensity of individual droplets. e Effect of droplet turnover on material properties of biomolecular condensates. Schematic illustration of the ATP-hydrolysis-regeneration system. f Fractions of the different droplet subpopulations characterized by DDM over 100 min of incubation: high-diffusive liquid (green), low-diffusive liquid (blue), and dynamically arrested (gray). Error bars represent the standard error of the mean of at least 15 different droplets per condition. g Mean mobile fraction extracted from FRAP measurements at time 0 (dark red) and after 100 min incubation (light red). In presence of polyU, the mobile fraction was about 91 ± 3% and remains almost constant over time. A similar behavior was observed for the Dhh1DQAD variant. When polyU was replaced with structured RNA, the mobile fraction decreased to 5 ± 5% over time, and this decrease could be partially rescued when coupled to an active system. Error bars represent standard deviation of mobile fractions of three different droplets. Source data for panels b, d, f, g are provided in the Source Data file.

