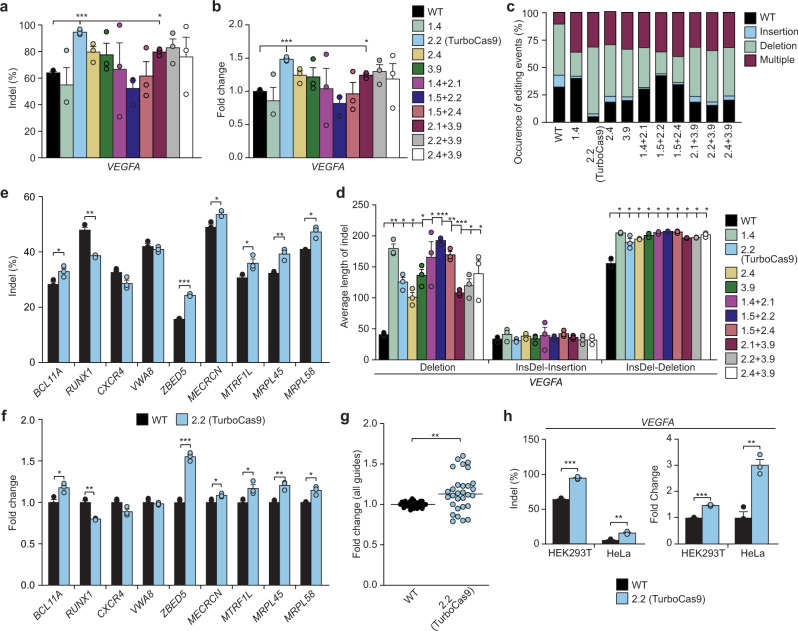
Fig. 3. Hyperactive Cas9 enzymes effectively generate large and complex mutations in mammalian cells.
a Percentage of indels introduced into the VEGFA gene by engineered Cas9 enzymes in HEK293T cells. b Fold change in Cas9 activity of selected mutants relative to wild-type Cas9. c Engineered Cas9 enzymes produce more complex, multiply edited mutations. d Engineered Cas9 enzymes introduce significantly larger deletions. e Percentage of indels introduced into BCL11A, RUNX1, CXCR4, VWA8, ZBED5, MTRF1L, MECRCN, MRPL45 and MRPL58 genes. f Fold change in designed Cas9 activity relative to wild-type Cas9. g Fold change distribution for individual samples for all 10 gRNAs. ANOVA testing identified that the increase in the activity of TurboCas9 was significant when considered across all mammalian gRNAs, with a significant difference between wild-type and TurboCas9 overall (p-value <0.0001) as well as for each guide (p-value <0.0001). h The type of cell line used has a significant effect on the efficiency of Cas9 and TurboCas9 between HEK293T and HeLa cells, displayed in percentage edited and fold change relative to wild-type Cas9 for the VEGFA gene. Error bars: s.e.m. for n = 3 biologically independent replicates. An FDR-adjusted Student’s t-test with a two-tailed distribution and unequal variance assumed between samples was used to calculate the significance. p-values: *p < 0.05, **p < 0.01, ***p < 0.001. Specific p-values for panels a, b for design vs WT: 2.2 p = 0.0006 and 2.1 + 3.9 p = 0.01 (FDR-adjusted Student’s t-test). Specific p-values for d for design vs WT for Deletions: 1.4 p = 0.004, 2.2 p = 0.01, 2.4 p = 0.02, 3.9 p = 0.01, 1.4 + 2.1 p = 0.04, 1.5 + 2.2 p = 0.0003, 1.5 + 2.4 p = 0.002, 2.1 + 3.9 p = 0.0005, 2.2 + 3.9 p = 0.02, 2.4 + 3.9 p = 0.05; for InsDel-Deletions: 1.4 p = 0.01, 2.2 p = 0.01, 2.4 p = 0.01, 3.9 p = 0.01, 1.4 + 2.1 p = 0.01, 1.5 + 2.2 p = 0.01, 1.5 + 2.4 p = 0.01, 2.1 + 3.9 p = 0.01, 2.2 + 3.9 p = 0.01 and 2.4 + 3.9 p=0.01 (FDR-adjusted Student’s t-test). Specific p-values for e: BCL11A p = 0.03, RUNX1 p = 0.01, ZBED5 p = 0.0003, MTRF1L p=0.05, MECRCN p = 0.05, MRPL45 p = 0.009 and MRPL58 p = 0.04 (FDR-adjusted Student’s t-test). Specific p-values for f for design 2.2 (TurboCas9) vs wild-type Cas9: BCL11A p=0.03, RUNX1 p=0.01, ZBED5 p = 0.0003, MTRF1L p = 0.05, MECRCN p = 0.05, MRPL45 p = 0.009 and MRPL58 p = 0.04 (FDR-adjusted Student’s t-test). For panel g p = 0.001 from a Student’s t-test for TurboCas9 vs wild-type Cas9 for all guides. For h the specific p-values for TurboCas9 vs wild-type Cas9 for HEK293T p = 0.0006 and HeLa p = 0.004 (FDR-adjusted Student’s t-test).

