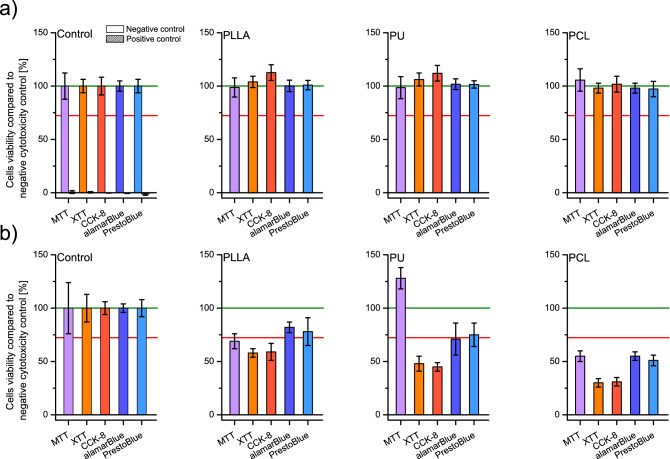
Figure 2.
Cells viability was tested by MTT, XTT, CCK-8, alamarBlue, and PrestoBlue assays (a) on scaffolds' liquid extracts after 24 h of incubation with PLLA, PU, and PCL; and (b) after 24 h of direct culture on PLLA, PU, and PCL scaffolds; including controls. In every graph, the green line represents the negative control result, and a red line represents the threshold for cytotoxicity level of 70% of cells viability compared to the negative control.

