
FIGURE 2.
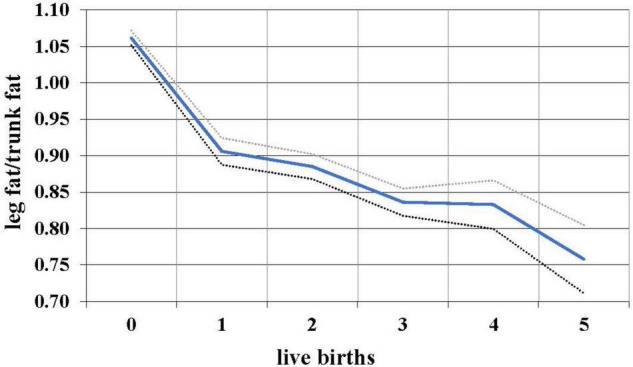
Relationship between live births and leg/trunk fat ratio in 7,753 women 12–49, with 95% confidence intervals, NHANES 1999–2006.
Official websites use .gov
A
.gov website belongs to an official
government organization in the United States.
Secure .gov websites use HTTPS
A lock (
) or https:// means you've safely
connected to the .gov website. Share sensitive
information only on official, secure websites.
Relationship between live births and leg/trunk fat ratio in 7,753 women 12–49, with 95% confidence intervals, NHANES 1999–2006.