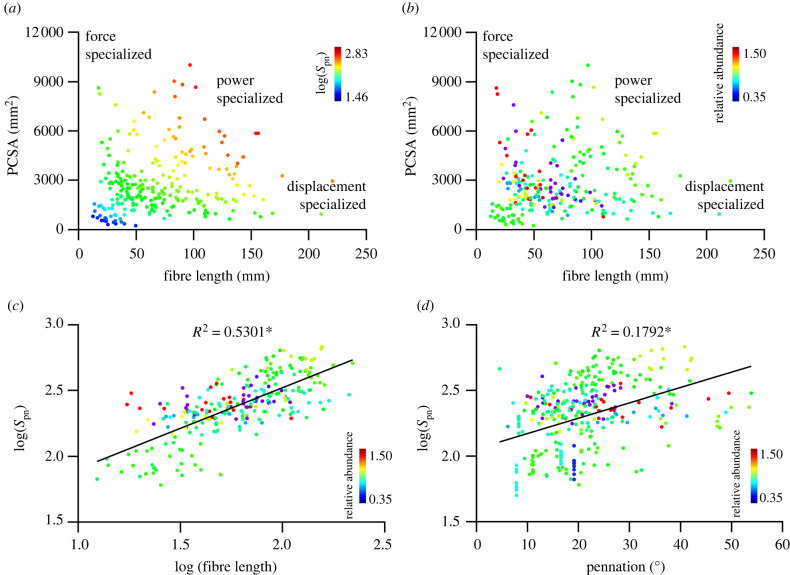
Figure 2.
Relationship between spindle composition and morphometric derived specialization. Relationship between muscle fibre length and PCSA across the 10 participants with heat map colouring representing predicted spindle number (Spn) (a) and spindle abundance (b). The relationship between log(Spn) and log(Lf) (c) and muscle pennation angle (d). *p < 0.05. (Online version in colour.)

