-
A
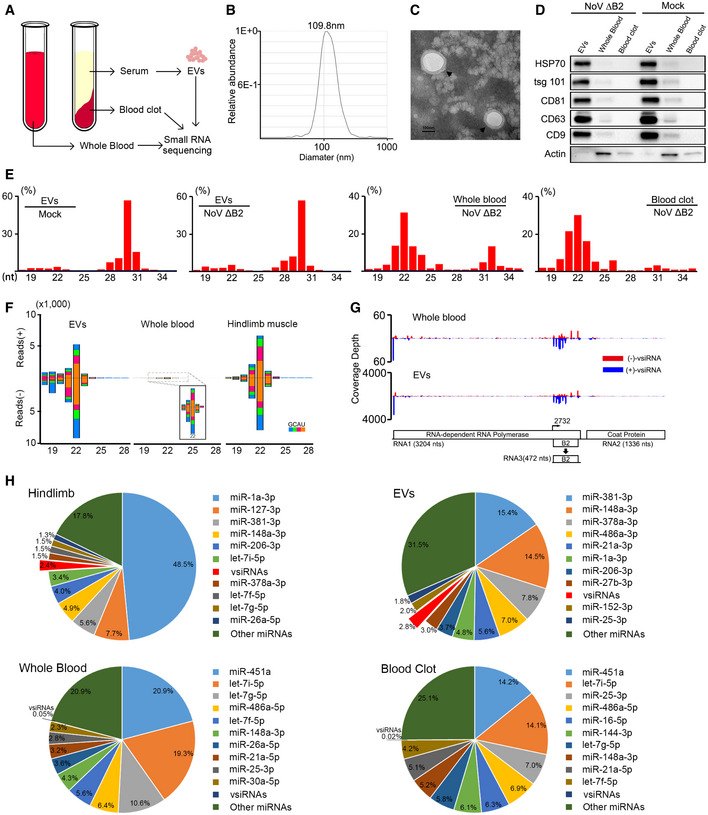
Model of sample preparation for small RNA deep sequencing.
-
B
Size distribution of the purified EVs analyzed by NTA.
-
C
TEM images of purified EVs. Scale bar: 100 nm.
-
D
Western blotting of HSP70, tsg 101, CD81, CD63, and CD9 in EVs, whole blood, and blood clot derived from suckling mice infected with DMEM or NoVΔB2. Staining of β‐actin was used as a loading control.
-
E
Size distribution of total sequenced small RNAs in the libraries constructed from EVs of DMEM challenged BALB/c suckling mice, and EVs, whole blood, blood clot of BALB/c suckling mice infected with NoVΔB2 at 3 dpi.
-
F, G
Size distribution of 18‐ to 28‐nt vsiRNAs (F) and genomic coverage depth of each nucleotide position by 21‐ to 23‐nt vsiRNAs (G) were analyzed from BALB/c suckling mice libraries infected by NoVΔB2 at 3 dpi.
-
H
Pie charts of the top ten most abundant miRNAs and vsiRNAs in hindlimb, EVs, whole blood, blood clot from BALB/c suckling mice infected by NoVΔB2 at 3 dpi. Red charts indicate 18‐ to 28‐nt vsiRNAs abundance. The percentage of miRNA reads was shown above. The abundance of total miRNAs and 18‐ to 28‐nt vsiRNAs reads was set as 1.

