-
A
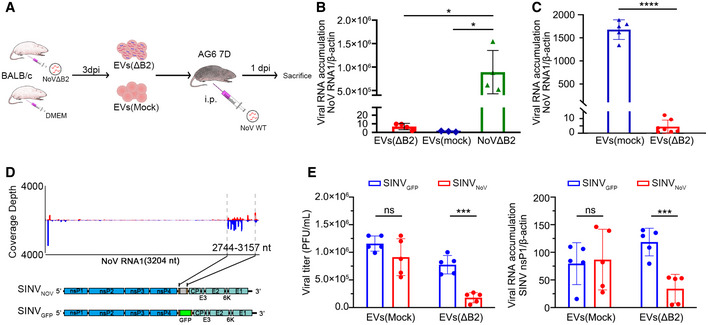
Schematic overview of antiviral function of EVs. Briefly, EVs from naïve or NoVΔB2‐infected BALB/c suckling mice were extracted 3 days post infection, and then injected into AG6 suckling mice. After 12 h post immunization, AG6 suckling mice were challenged by WT NoV and then sacrificed at 1 dpi.
-
B
NoV replication was determined by RT–qPCR from hindlimb muscle of AG6 suckling mice challenged with NoVΔB2 as control or EVs from naïve or NoVΔB2‐infected BALB/c suckling mice at 3 dpi. Normalization was done by β‐actin mRNA levels. * indicates P < 0.05 by Student’s t‐test. n = 3–4 per group. Data are shown as mean ± SD.
-
C
Relative viral RNA1 accumulation levels at 1 dpi in NoV WT‐infected AG6 mice 12 h after injection with EVs from NoVΔB2 or mock‐inoculated BALB/c mice were measured by RT–qPCR. Normalization was done by β‐actin mRNA levels. **** indicates P < 0.0001 by Student’s t‐test. n = 5–6 per group. Data are shown as mean ± SD.
-
D
Diagram of recombinant SINVNoV (top) and SINVGFP (bottom). The gene of B2 protein was inserted at downstream of the duplicated subgenomic promotor sequence as shown.
-
E
AG6 suckling mice were challenged with EVs from naïve or NoVΔB2‐infected BALB/c suckling mice and then inoculated by SINVNoV and SINVGFP respectively. Viral titer (PFU/ml) in the hindlimb muscle of infected mice was measured by a standard plaque assay and normalized by tissue mass, and the viral genomic RNA accumulation was determined by RT–qPCR amplification of the viral nsP1 coding region. Normalization was done by β‐actin mRNA levels. *** indicates P < 0.001, ns indicates no significant difference by Student’s t‐test, n = 5 per group. Data are shown as mean ± SD.

