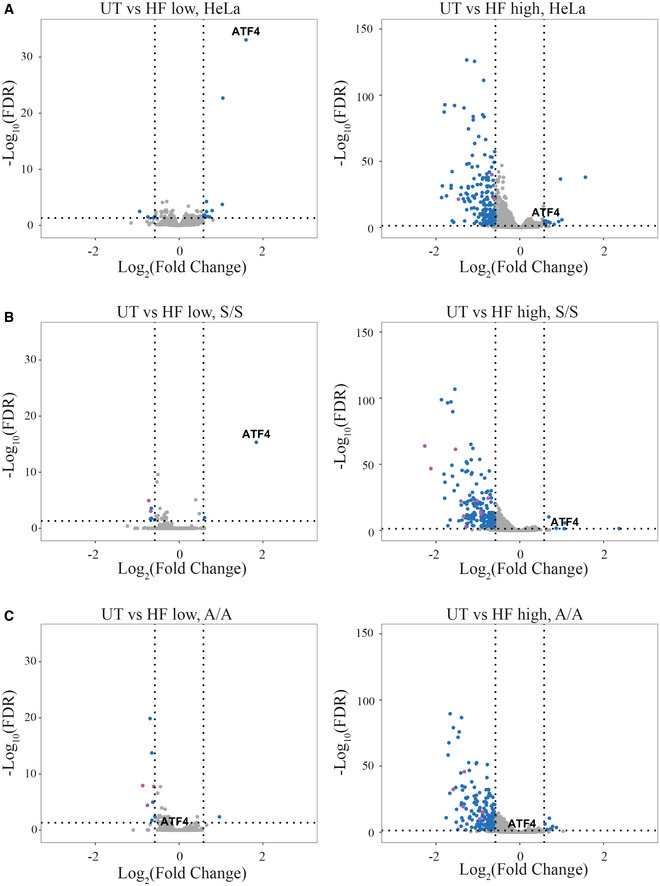
Figure 3. Global quantitative proteomic analyses of cell response to HF.

- Tandem mass tag mass spectrometry analyses performed in triplicate from HeLa cells treated with 12.5 or 312.5 nM HF for 5 h.
- Similar to (A), but using eIF2αS/S MEF cells treated with 12.5 or 200 nM HF for 5 h.
- Similar to (B), but using eIF2αA/A cells.
Data information: Results are presented as pairwise comparisons. Data points in magenta represent collagen proteins. Vertical dashed lines indicate Log2(Fold change) = 0.58 and that corresponds to 1.5‐fold change.
