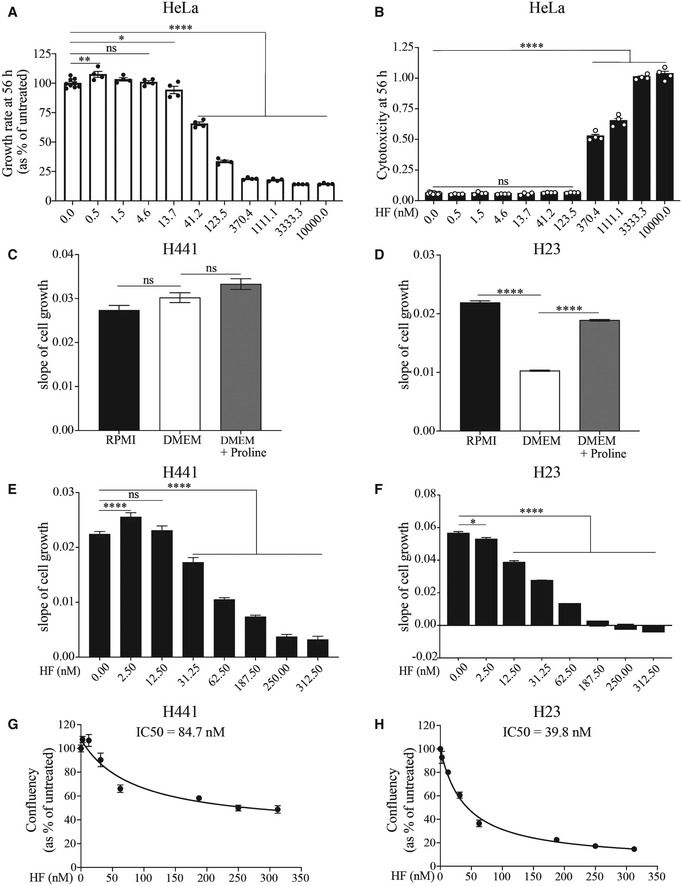
Figure 7. Proline‐dependent cells are sensitized to the cytotoxic effects of HF.

-
A, BGrowth rate and cytotoxicity (CellTox Green Dye) at 56 h of HeLa cells treated with indicated concentrations of HF and monitored at 37°C in an Incucyte S3 system (Fig EV5A). Data are mean (n ≥ 4 biological replicates) ± SEM. *P = 0.0481, **P = 0.0047, ****P < 0.0001, as determined by one‐way ANOVA with Dunnett’s multiple comparison test. ns: not significant.
-
C, DSlope of cell growth of H441 (C) and H23 (D) lung cancer cell lines grown for 72 h in RPMI (containing 20 mg/l Proline) media versus DMEM (Proline‐free) or DMEM supplemented with 20 mg/l Proline. Data are mean (n = 4 biological replicates) ± SEM. ****P < 0.001 as determined by one‐way ANOVA with Dunnett’s multiple comparison test. ns: not significant. Slope of cell growth was determined by simple linear regression curve fit of cellular growth rate in distinct conditions over 72 h presented in Fig EV5C and D.
-
E, FSlope of cell growth of H441 (E) and H23 (F) cells exposed to indicated concentrations of HF for 72 h at 37°C. Data are mean (n = 3 biological replicates) ± SD. *P = 0.0151, ****P < 0.0001, as determined by one‐way ANOVA with Dunnett’s multiple comparison test. Slope of cell growth was determined by simple linear regression curve fit of cellular growth rate in distinct conditions over 72 h presented in Fig EV5E and F.
-
G, HAnalysis of IC50 values of HF on confluency at 72 h endpoint of H441 (G) and H23 (H) cells normalized to control conditions and determined by nonlinear regression curve fit for inhibitory dose‐response (IC50). Each point represents mean (n = 3 biological replicates) ± SD.
