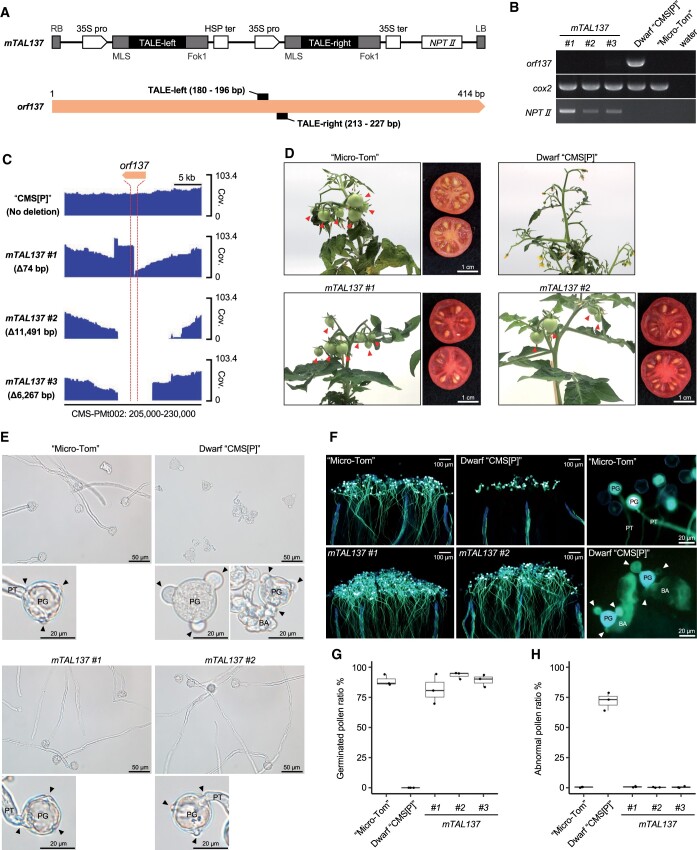
Figure 1.
orf137 triggers cytoplasmic male sterility in tomato. A, mTAL137 construct and binding sites of each TALEN in the orf137 sequence. LB, left border; RB, right border; 35S pro, cauliflower mosaic virus (CaMV) 35S promoter; 35S ter, CaMV terminator; HSP ter, Arabidopsis heat shock protein terminator; MLS, mitochondrial localization signal. B, PCR analysis of orf137 in mTAL137 T0 lines. “Micro-Tom”, which does not have the orf137 gene, and water served as negative controls; cytochrome oxidase subunit 2 (cox2) served as the mitochondrial genome control; and neomycin phosphotransferase II (NPTII) served as the marker gene for the mTAL137 vector. C, Long-read sequencing coverage of orf137 and its vicinity (CMS-PMt002: 205,000–230,000 bp; accession number LC613119 in the DDBJ database) in mTAL137 T0 lines. The location of orf137 is indicated by the red dashed lines. The read coverage of “CMS[P]”, in which the mTAL137 construct was not introduced, was obtained from our previous report (Kuwabara et al., 2021). Cov., read coverage. D, Fruit and seed formation in mTAL137 T0 lines. Red arrows indicate the fruits on the plants. E, Phenotypes of pollen after 4 h of incubation in germination media for “Micro-Tom”, Dwarf “CMS[P]”, and mTAL137 T1 lines. Black arrows indicate the positions of apertures. PG, pollen grain; PT, pollen tube; BA, burst aperture. F, Phenotypes of pollen stained with aniline blue 24 h after pollination on stigma for “Micro-Tom”, Dwarf “CMS[P]”, and mTAL137 T1 lines. White arrows indicate the positions of apertures. PG, pollen grain; PT, pollen tube; BA, burst aperture. G, Germinated pollen ratio 4 h after incubation in germination media for “Micro-Tom”, Dwarf “CMS[P]”, and mTAL137 T1 lines. The boxplots represent interquartile ranges, the black center lines indicate the medians, and the whiskers represent 1.5 × interquartile ranges. Each point indicates the value for each experiment. Values were calculated from three independent experiments (n = 3). H, Abnormal pollen ratio 4 h after incubation in germination media for “Micro-Tom”, Dwarf “CMS[P]”, and mTAL137 T1 lines. The boxplots represent interquartile ranges, the black center lines indicate the medians, and the whiskers represent 1.5 × interquartile ranges. Each point indicates the value for each experiment. Values were calculated from three independent experiments (n = 3).

