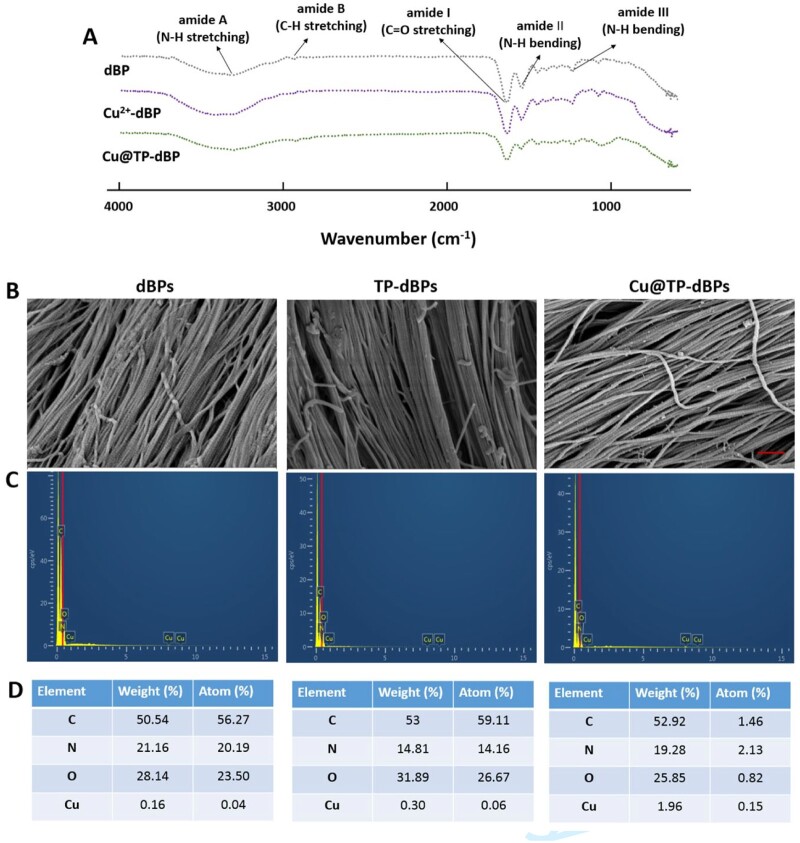
Figure 2.
FTIR and SEM-EDS analysis of Cu@TP-dBPs. FTIR spectra of dBPs, Cu2+-dBPs, Cu@TP-dBPs (A). SEM top-view of surface microstructures (B), EDS spectra of corresponding SEM images (C) and elemental compositions in the interior detected by EDS maps (D): C, carbon; N, nitrogen; O, oxygen; Cu, copper. Scale bar = 600 nm

