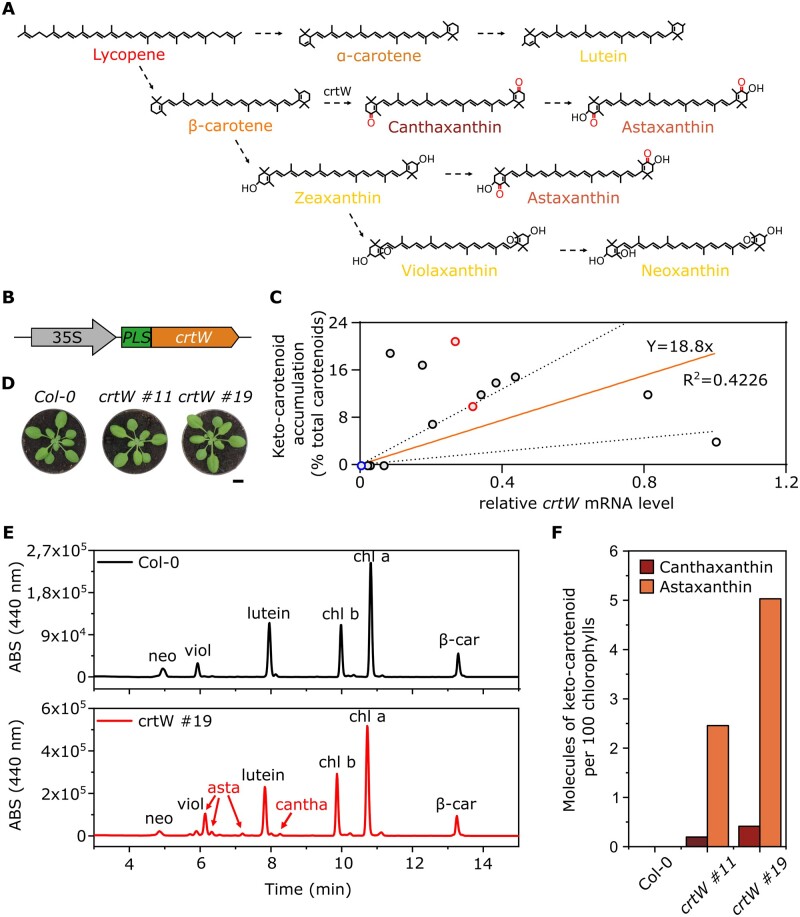
Figure 2.
Pigment content analysis of keto-carotenoid A. thaliana transgenic lines. A, Overview of the biosynthetic carotenoid pathway after the addition of the crtW enzyme; dotted arrows represent multiple enzymatic steps. B, Scheme of the synthetic construct for canthaxanthin production: CaMV 35s promoter; PLS; β-carotene ketolase (crtW). C, Relative crtW mRNA levels and their corresponding keto-carotenoid content in 13 independent transgenic lines (black and red circles) and one Col-0 (blue circle); red circles represent the two lines (#11 and #19) chosen for the following experiments. mRNA levels in the graph are relative to the transgenic line with the highest expression, set as 1. The orange line represents the curve fitted to the data with linear regression, and the dotted lines are the 95% prediction confidence intervals. The R2 and the equation of the curve are shown. D, Phenotypic comparison between Arabidopsis Col-0 plants and two independent crtW transgenic lines. The images in (D) were digitally extracted for comparison. Scalebar 1 cm. E, HPLC analysis for canthaxanthin and astaxanthin detection in a crtW line (red line), compared with a Col-0 plant (black line); neoxanthin (neo), violaxanthin (viol), astaxanthin (asta), canthaxanthin (cantha), chlorophyll b (chl b), chlorophyll a (chl a), β-carotene (β-car). F, Quantitative measurement of canthaxanthin and astaxanthin from isolated thylakoids (one single extract from 20 3-week-old, ketocarotenoid-producing plants), represented as molecules of keto-carotenoid per 100 molecules of chlorophylls.

