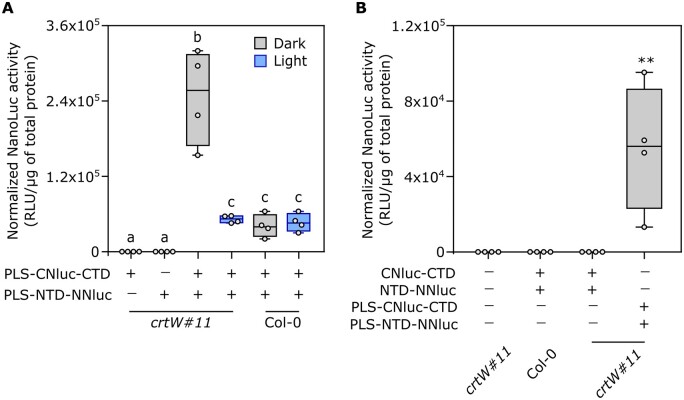
Figure 3.
Activity of the synthetic photoswitch in a transient protoplasts assay. A, Light response in Arabidopsis Col-0 and transgenic crtW-isolated protoplasts. Different letters indicate statistical differences (P ≤ 0.05) calculated from one-way ANOVA (n = 4) followed by Tukey’s post-hoc test. “Light” indicates treatment with under blue light (465–480 nm, 350 µmol μm−2 s−1) for 1 h. B, Comparison between plastidial and nonplastidial localization of photoswitch components. Protoplasts were treated with either dark or blue light (350 µmol μm−2 s−1) for 1 h. Asterisks indicate statistical differences calculated from one-way ANOVA (P ≤ 0.01, n = 4). In the box plots, dots represent biological replicates, the black line marks the median, and the box indicates the interquartile range (IQR). Whiskers extend to data points below 1.5× IQR away from the box extremities.

