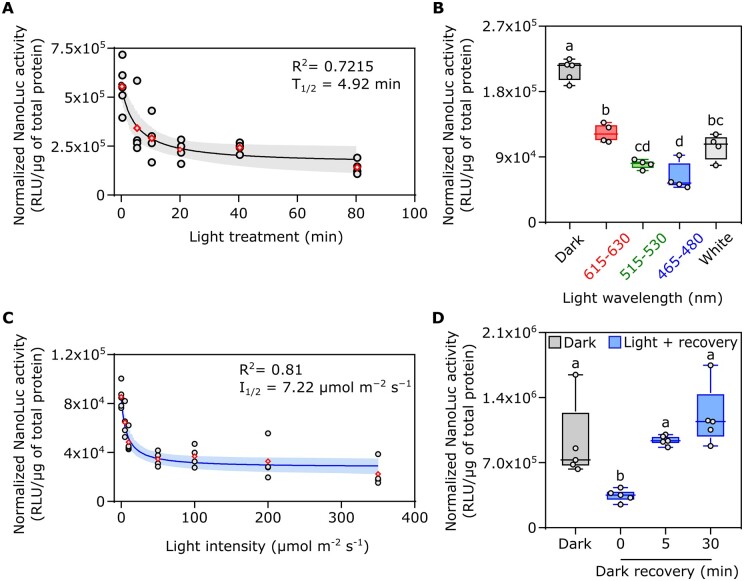
Figure 4.
Characterization of the split-NLucOCP2 photoswitch in A. thaliana protoplasts. A, Impact of different lengths of light exposure (white light, 350 µmol m−2 s−1) on photoswitch output. Data points correspond to 0, 5, 10, 20, 40, and 80 min. B, Effect of different wavelengths on the output of the photoswitch, as compared to darkness. Red, green, blue, or white light was supplied for 20 min at 350 µmol m−2 s−1). C, Output modulation under increasing light intensity. Protoplasts were exposed to 5, 10, 50, 100, 200, or 350 µmol m−2 s−1 blue light for 20 min after 16-h dark incubation (initial data point). D, Test of the reversibility of the photoswitch. After light treatment (20 min, 50 μmol m−2 s−1, blue light), the samples were incubated for 5 or 30 min in the dark before sampling. In the box plots, dots represent biological replicates, the black line marks the median, and the box indicates the IQR. Whiskers extend to data points that are below 1.5× IQR away from the box extremities. Different letters indicate statistical differences (P ≤ 0.05) calculated from one-way ANOVA followed by Tukey’s post-hoc test (n ≥ 4). In dot plots, data fitting through nonlinear regression analysis is shown with blue continuous curves, generated using the GraphPad Prism built-in equation for [Inhibitor] versus response model. Shaded bands indicate the predicted 95% confidence interval. Black dots represent single data points and red rhombuses represent mean values. The R2, T1/2 of the curves are included in the graphs.

