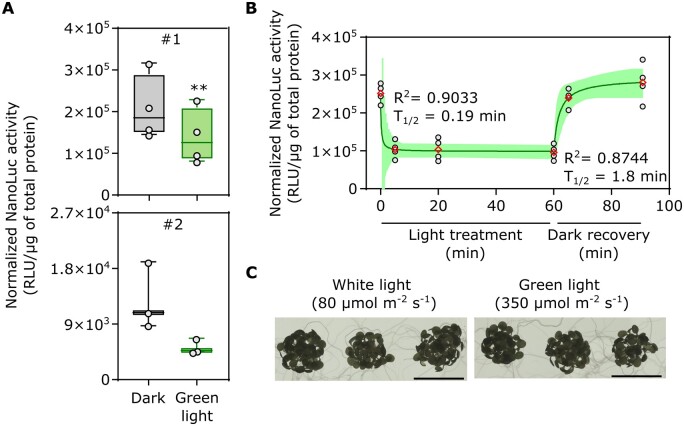
Figure 5.
Characterization of the split NLuc-OCP2 photoswitch in A. thaliana stably transformed plants. A, Luminescence of two independent lines (#1, #2) carrying both the PLS-CNLuc-CTD and the PLS-NTD-NNLuc modules, treated with dark or green light (20 min, 350 µmol m−2 s−1). B, Effect of different duration of light exposure (green light, 350 µmol m−2 s−1) and dark recovery on line#1 luminescence. Data points correspond to 0, 5, 20, and 60 min of light exposure, followed by 5 and 30 min of dark recovery. In the box plots, dots represent biological replicates, the black line marks the median, and the box indicates the IQR. Whiskers extend to data points that are below 1.5× IQR away from the box extremities. A Student t test was used to assess significant differences. Asterisks indicate statistical differences (P ≤ 0.01, n ≥ 3). In the dot plot, data fitting through nonlinear regression analysis is shown by a green continuous curve. Shaded bands indicate the predicted 95% confidence interval. Black dots represent single data points and red diamonds represent mean values. The R2 and T1/2 of the curves are included in the graphs. C, Comparison of seedlings treated with high-intensity green light for 1 h or with low-intensity white light. No difference was visible.

