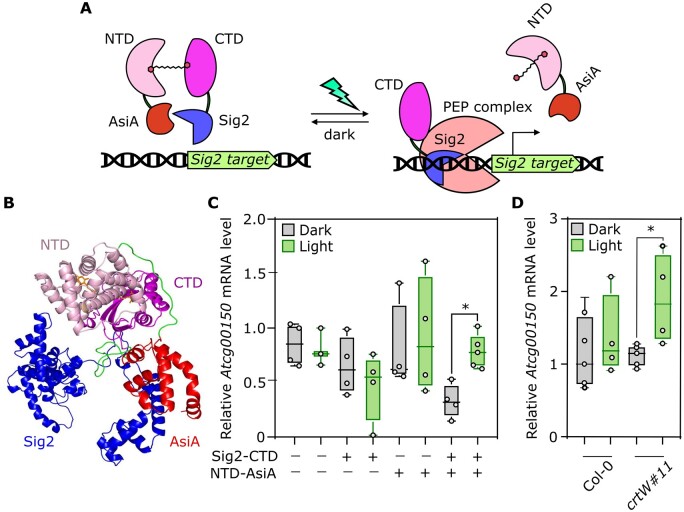
Figure 6.
Design and validation of a strategy to control chloroplast gene expression in response to blue–green light. A, Scheme of the desired genetic circuit, based on association/dissociation of the DNA–RNA polymerase complex. On the left, the association between the two OCP2 modules in the dark results in the interaction between Sig2 and AsiA, preventing PEP–Sig2–DNA association by steric hindrance. On the right, after blue–green light treatment, AsiA dissociation allows Sig2 to recruit the PEP complex and consequently to induce gene transcription. B, In silico prediction of Sig2–CTD and NTD–AsiA interaction in the presence of the keto-carotenoid. C, RNA level of the Sig2 target Atcg00150 in response to darkness or green light (350 µmol m−2 s−1) for 4 h in crtW leaves infiltrated with different combinations of agrobacteria bearing the constructs Sig2–CTD and NTD–AsiA. D, Comparison of Atcg00150 transcript between Col-0 and crtW plants agroinfiltrated with Sig2–CTD and NTD–AsiA after a 4-h dark or green light (350 µmol m−2 s−1) treatment. A Student t test was used to assess significant differences. Asterisks indicate statistical differences (P ≤ 0.01, n = 4). In the box plots, dots represent biological replicates, the black line marks the median, and the box indicates the IQR. Whiskers extend to data points below 1.5× IQR away from the box extremities.

