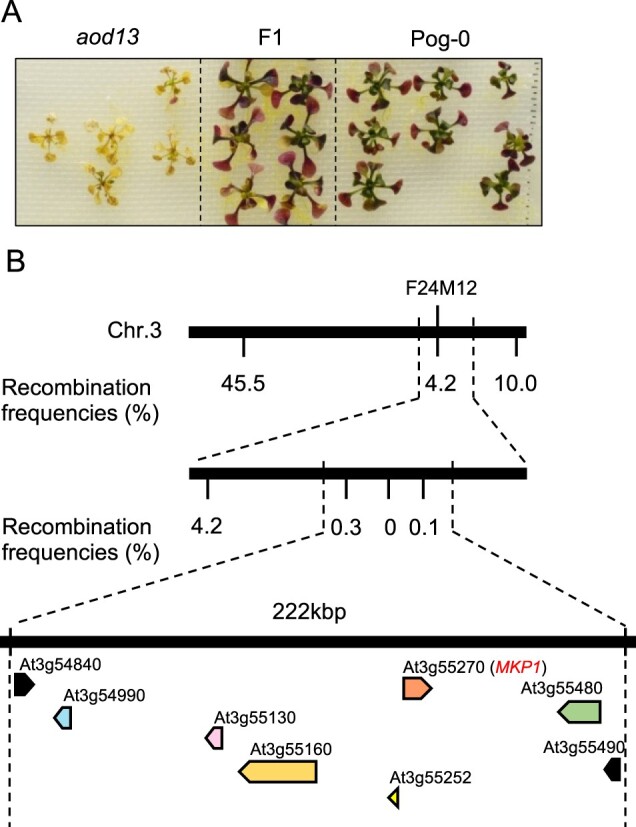
Figure 2.

High-resolution mapping of the causal locus in aod13. A, Phenotypes of F1 progeny derived from a cross between aod13 and accession Pog-0. B, High-resolution mapping of the causal locus in aod13 by using F2 progeny between aod13 and Pog-0. The scores indicate recombination frequencies (%). Genes located in the causal locus are shown as arrows. Arabidopsis Genome Initiative numbers are shown above the genes.
