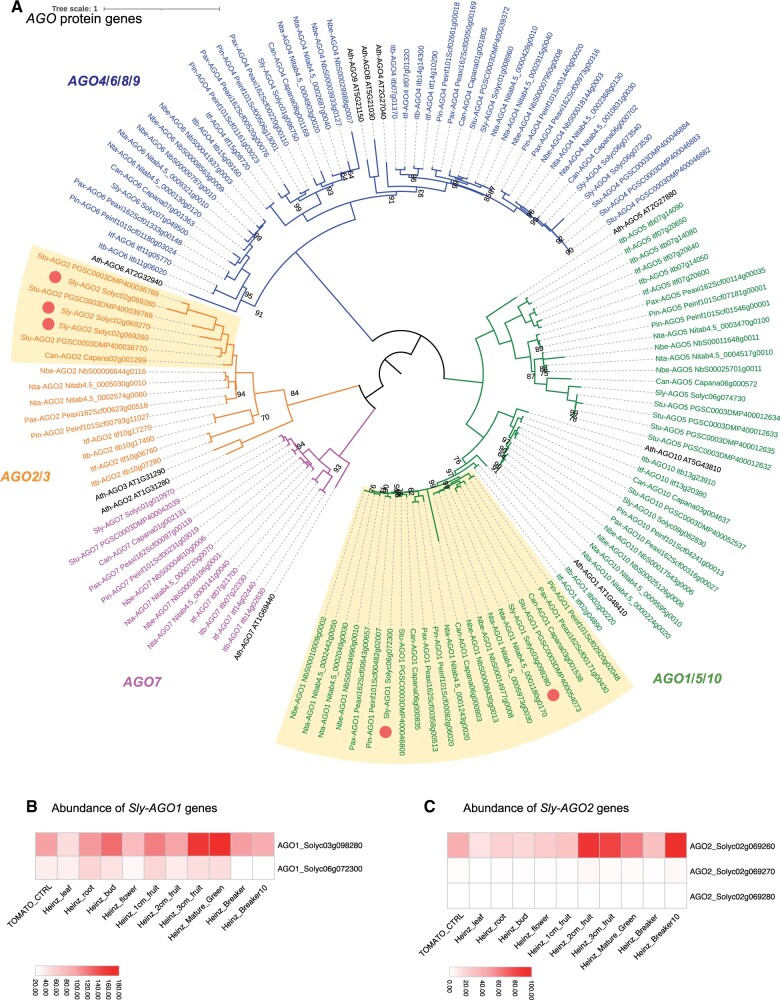
Figure 1.
Solanaceae-specific diversification of the AGO family highlights expansion and subfunctionalization of subfamily members. Phylogenetic tree of proteins encoded by the AGO gene family in the Solanaceae (A). Clades of AGO subfamily members are drawn with distinct colors. A boxe highlights a group of AGO genes that have expanded in Solanaceae. Circles indicate AGO homologs in tomatoes. Heatmaps show the relative expression of AGO1 (B) and AGO2 (C) in different tomato samples. Orthologous protein groups were identified using OrthoFinder and SonicParanoid. Protein alignments and phylogeny analysis were completed using MUSCLE and IQ-TREE. Phylogenetic tree was illustrated using iTOL. The scale bar and branch lengths in (A) correspond to the expected number of substitutions per site. The scale bars in (B and C) show expression of AGO paralogs across samples normalized as reads per million (RPM).

