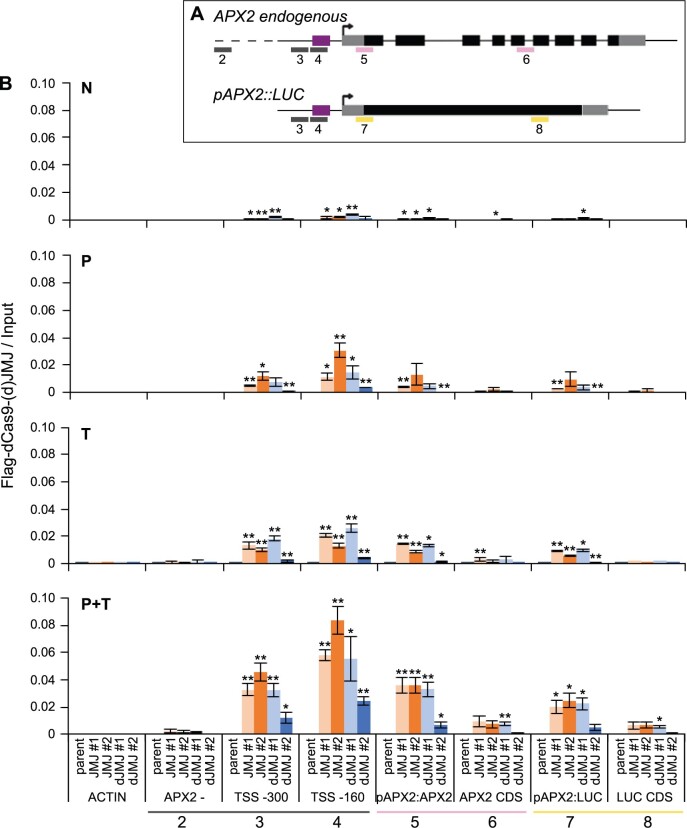
Figure 5.
dCas9–(d)JMJ proteins bind APX2 after HS. A, Schematic representation of positions of analyzed amplicons by ChIP-qPCR. For the APX2 endogenous locus and the pAPX2600 bp::LUC transgene, the TSS is shown with a black arrow, UTRs are shown as gray boxes, exons are shown as black boxes, and the introns of the endogenous APX2 are shown as black lines. The sgRNA cassette a binding area is shown as purple box. Amplicons are shown as colored lines below the gene models. Pink amplicons are specific for APX2 endogenous, yellow amplicons are specific for pAPX2600 bp::LUC, and gray amplicons are not specific, that is, amplicons 3 and 4 amplify both the endogenous APX2 and the transgene. 2, APX2 – (3 kb upstream of At3g09640); 3, TSS −300 bp; 4, TSS −160 bp; 5, pAPX2-APX2; 6, APX2 CDS; 7, pAPX2-LUC; 8, LUC CDS. B, Occupancy of dCas9–JMJ and dCas9–dJMJ as determined by ChIP-qPCR. Sampling time points as described in Figure 4. Amplicons shown on the x-axis as indicated in (A), an amplicon of the ACTIN locus is shown as control. Enrichment normalized to Input. Data are mean ± sem of three independent experiments. Asterisks mark significant differences to amplicon 2 (APX2−) of the same genotype (unpaired two-sided t test, *P < 0.05, **P < 0.01).

