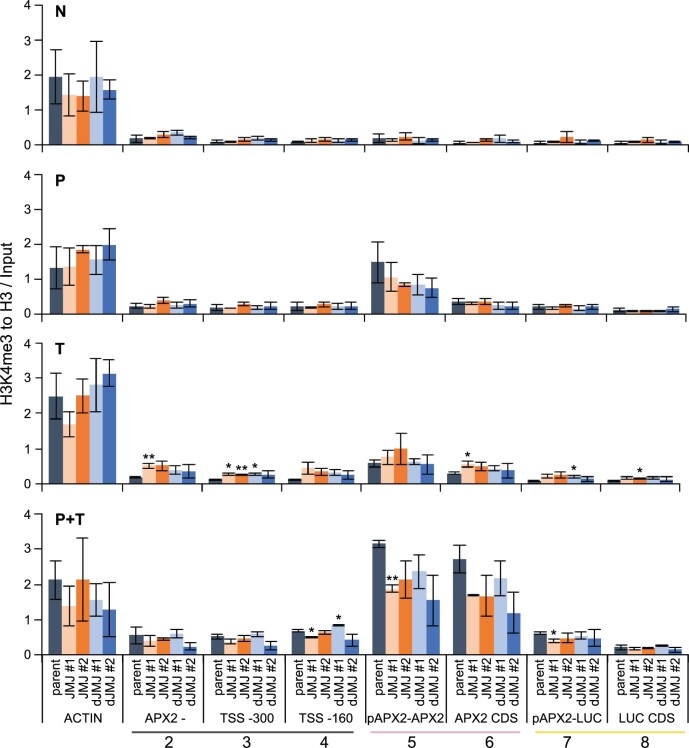
Figure 6.
Epigenome editing reduces H3K4me3 enrichment after HS. Enrichment of H3K4me3 as determined by ChIP-qPCR. Sampling time points as described in Figure 4A. Amplicons shown on the x-axis as indicated in Figure 5A, an amplicon of the ACTIN locus is shown as control. Enrichment is normalized to histone H3 and Input. Data are mean ± sem of three independent experiments. Asterisks mark significant differences to parent (unpaired two-sided t test, *P < 0.05, **P < 0.01).

