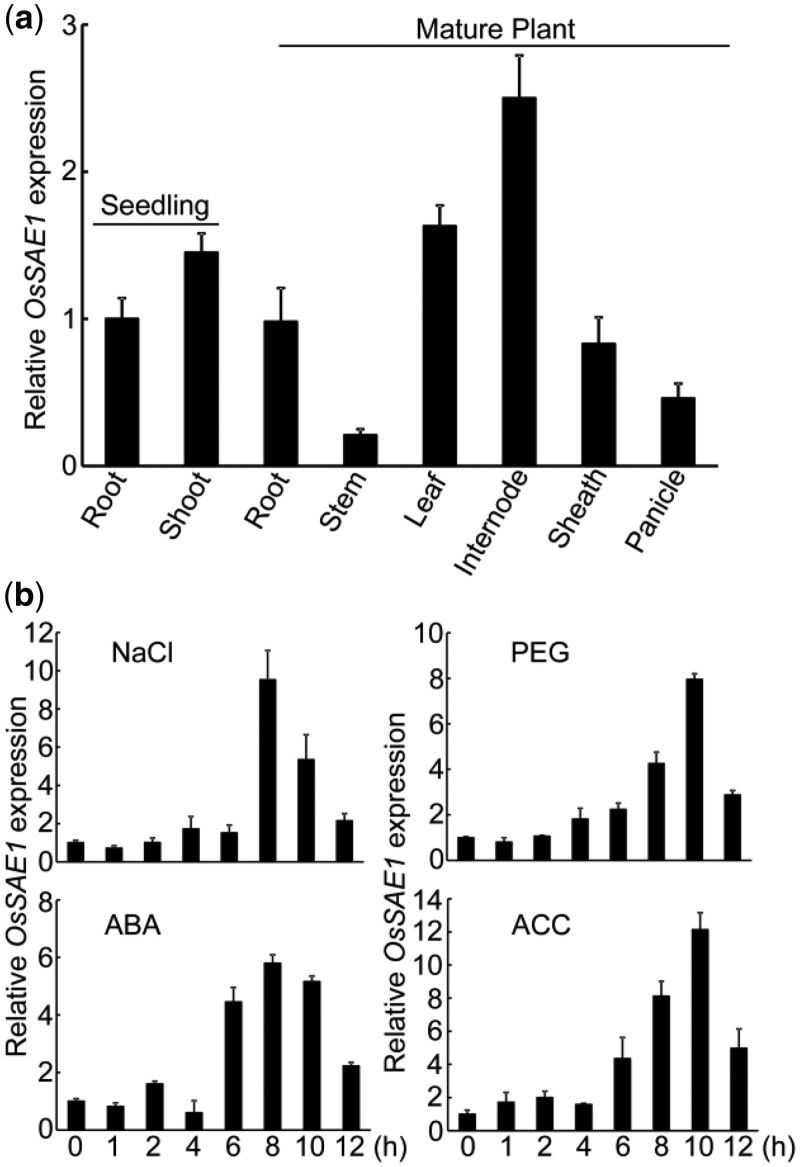
Figure 2.
OsSAE1 expression in different plant tissues and under stress and hormone treatments. A, OsSAE1 expression in different seedling and mature rice tissues. B, Expression of OsSAE1 in response to salt (NaCl), PEG, ABA, and ACC. The 10 DAI Nip seedlings were treated with 150-mM NaCl, 10% (w/v) PEG6000, 10-μM ABA, or 10-μM ACC for 0, 1, 2, 4, 6, 8, 10, and 12 h. RNA was isolated from shoots and used for RT-qPCR. Actin1 was used as an internal control. The relative expression levels were represented by fold change relative to the expression levels of root (A) or 0 h (B). The error bars indicate the sds based on three independent replicates.

