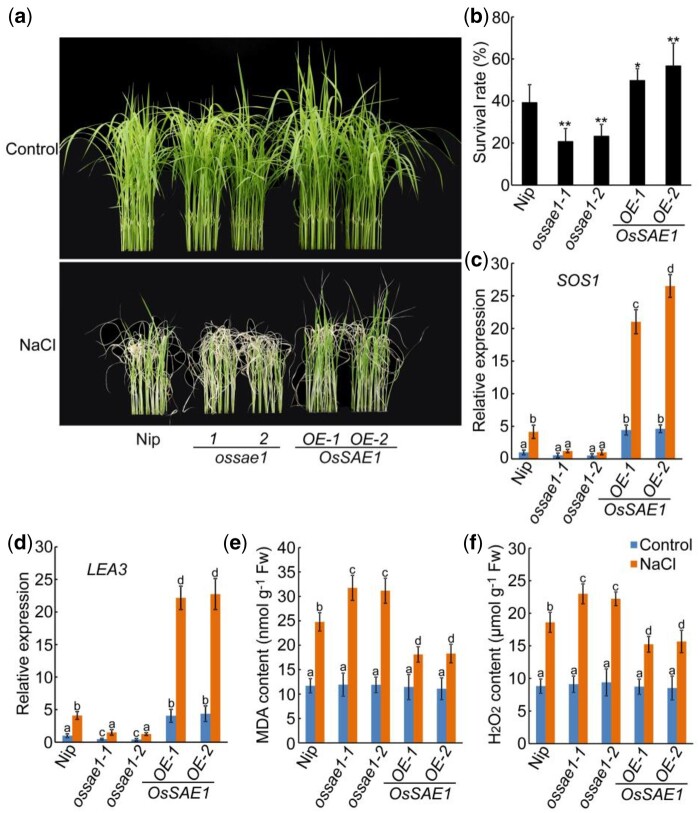
Figure 4.
OsSAE1 positively regulates salt tolerance in rice seedlings. A, Phenotypes of Nip, OsSAE1-OE, and OsSAE1 knockout (ossae1) seedlings under salt stress. The images of the plants were digitally extracted for comparison. B, Survival rates of the plants shown in (A), 7 d after stopping salt stress. Approximately 50–60 seedlings were used per experiment. Data show mean ± sd of three independent replicates. Asterisks indicate significant differences compared to Nip at *P < 0.05 and **P < 0.01 by Student’s t test. C and D, Expression of SOS1 (C) and LEA3 (D) in Nip, OsSAE1-OE, and ossae1 seedlings with or without salt treatment. Ten DAI seedlings were treated with or without 150-mM NaCl for 6 h. RNA was isolated from shoots and used for RT-qPCR. Actin1 was used as an internal control. The relative expression levels were represented by fold change relative to the expression levels of Nip-control. E and F, MDA (E) and H2O2 (F) contents in leaves of 10 DAI seedlings with or without 150-mM NaCl treatment for 3 d. For (C, D, E, and F), the error bars indicate the sds based on three independent replicates, different letters indicate significant differences (P < 0.05, one-way ANOVA with Tukey’s test).

