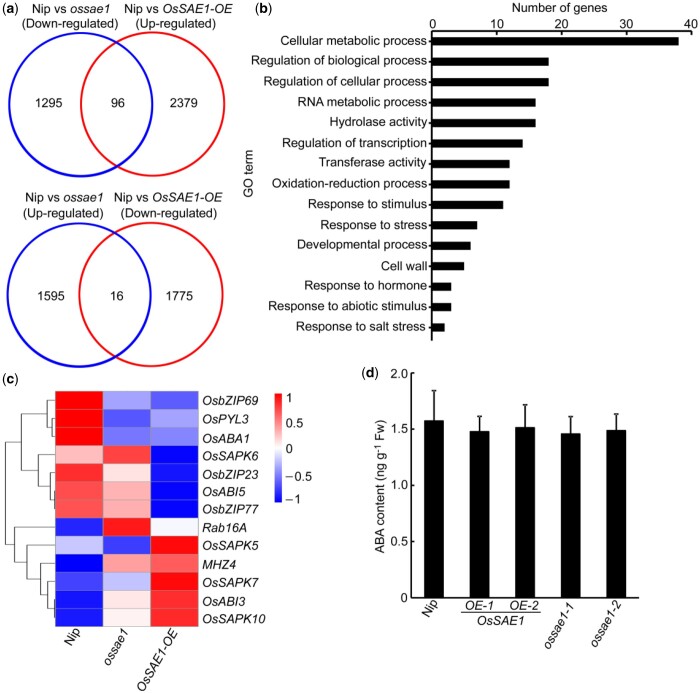
Figure 5.
Transcriptome analysis of DEGs regulated by OsSAE1. A, Venn diagrams of the DEGs upregulated and downregulated in OsSAE1-OE and OsSAE1 knockout (ossae1) seedlings compared with Nip. B, GO term analysis of OsSAE1-regulated genes. C, Heat map of microarray expression profiles for ABA biosynthesis and signaling-related genes. D, ABA contents in 5 DAI Nip, OsSAE1-OE, and ossae1 seedlings. The error bars indicate the sds based on three independent replicates. Asterisks indicate significant differences compared to Nip at *P < 0.05 and **P < 0.01 by Student’s t test.

