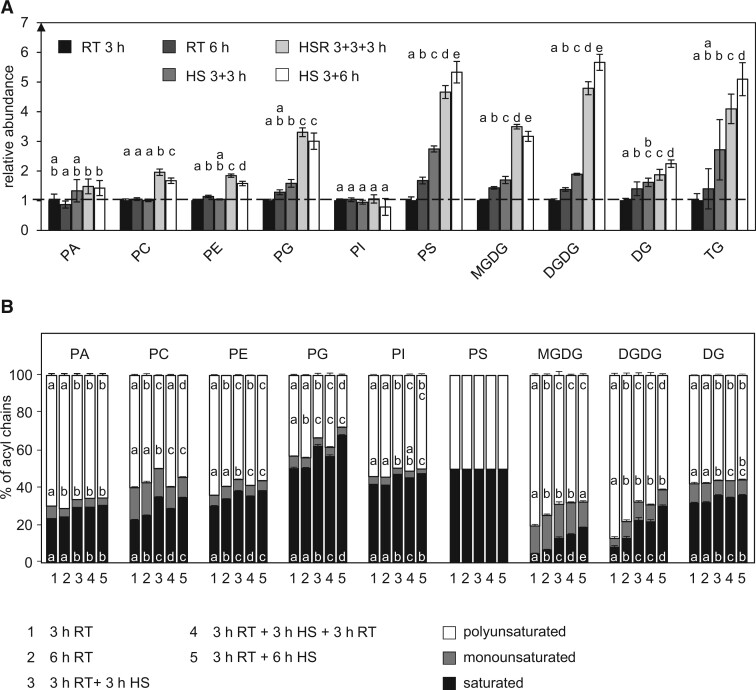
Figure 2.
HS changes lipid subclass composition and decreases saturation of acyl chains A, Abundances of the depicted lipid subclasses of pollen tubes grown under different temperature regimes were measured by UPLC-nanoESI-MS/MS and normalized to their respective values after 3 h RT. B, Relative saturation of the respective lipid subclasses under the same temperature regimes. The levels of the molecular lipid species containing zero (saturated), one (monounsaturated), or more than one (polyunsaturated) double bonds in their fatty acid residues were summed per lipid subclass and converted into relative molar proportions. n = 5. Error bars represent standard deviation. For statistical analysis, ANOVA was performed (significance level α = 0.05), followed by post hoc Tukey’s analysis. Results are presented as compact letter display of all pair-wise comparisons.

