Figure 5.
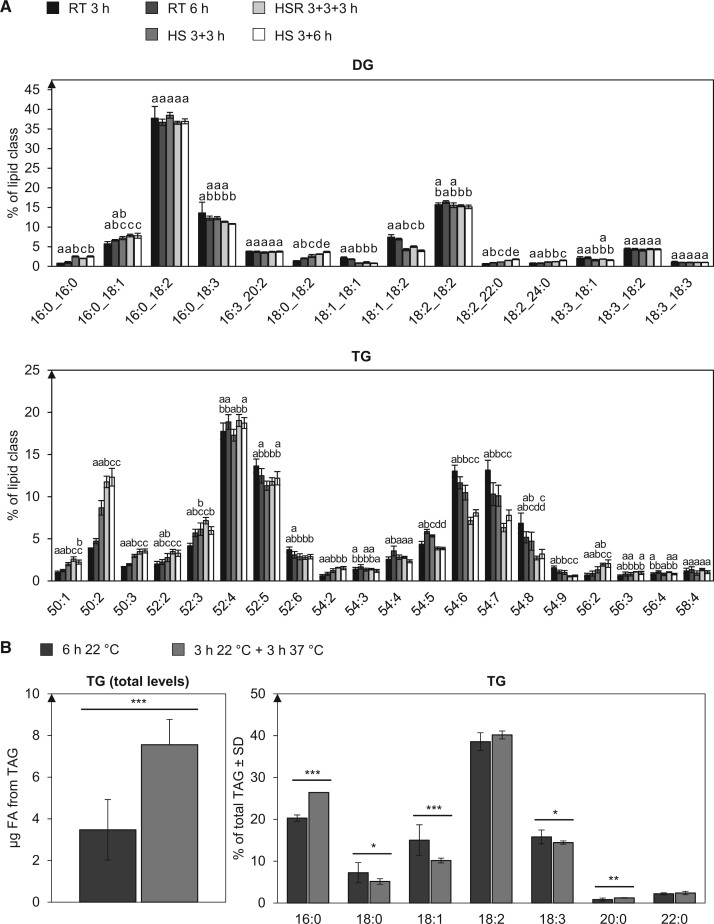
TG accumulates under HS and becomes more saturated. A, The depicted lipid subclasses from pollen tubes grown under different temperature regimes were investigated. Lipid subclass profiles were measured by UPLC-nanoESI-MS/MS. Values are given as mol % of all detected lipid species per subclass. Only major lipid species (>1% of total) are depicted. For statistical analysis, ANOVA was performed (significance level α = 0.05), followed by post hoc Tukey’s analysis. n = 5. Error bars represent standard deviation. Results are presented as compact letter display of all pair-wise comparisons. B, Absolute quantification of TG from heat stressed and non-stressed pollen tubes per 1 mg of dry pollen. Also shown is the relative contribution of the respective fatty acids to the total TG amount. Measurements were performed with GC-FID and quantified as peak areas. n = 5. Error bars represent standard deviation. ***P < 0.005; **P < 0.001; *P < 0.05; determined by Student’s t test.

