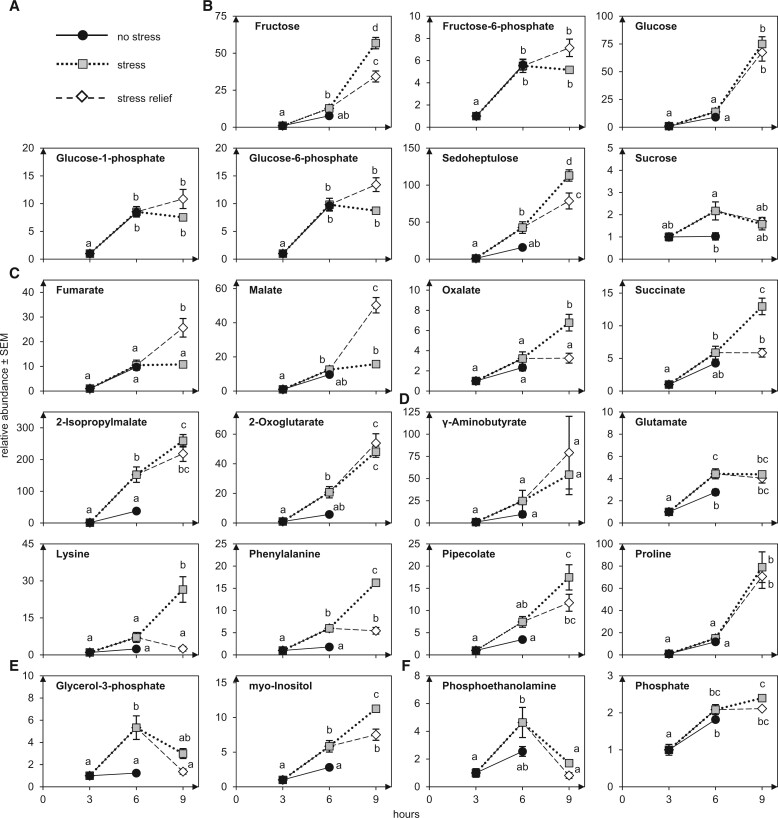
Figure 9.
The abundance of several metabolites is affected by HS. A, Legend: black line and filled black circles: no stress (RT 3 h and RT 6 h); dotted line and gray squares: HS (3 + 3 h and 3 + 6 h); dashed lines and white rhombus:HSR (3 + 3 + 3 h). Shown are a selection of detected sugars (B), a selection of detected organic acids (C), a selection of detected amino acids (D), a selection of detected polyols (E) and others (F). n = 5. Metabolites are normalized to the value at 3 h. Error bars represent standard deviation. For statistical analysis, ANOVA was performed (significance level α = 0.05), followed by post hoc Tukey’s analysis. Results are presented as compact letter display of all pair-wise comparisons in increasing order.

