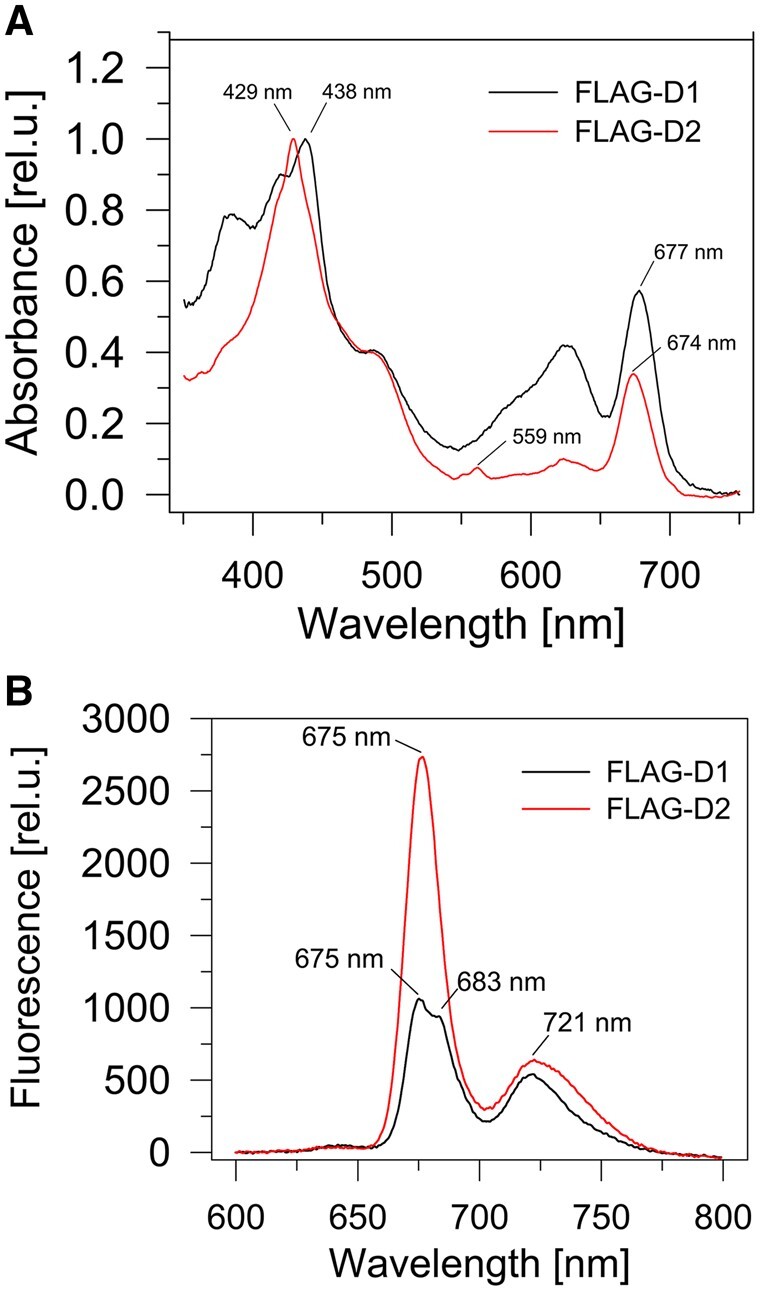
Figure 5.

Spectroscopic analysis of FLAG-D1 and FLAG-D2. Room temperature absorption spectra (A) and 77 K Chl fluorescence spectra (B) of FLAG-D1 and FLAG-D2. The preparations were isolated using FLAG affinity chromatography from strains lacking PSII Chl-binding subunits and expressing either FLAG-D1 or FLAG-D2. The absorption spectra were normalized to blue maxima, while measurements of the fluorescence spectra were performed using identical volumes of the obtained preparations.
