Figure 6.

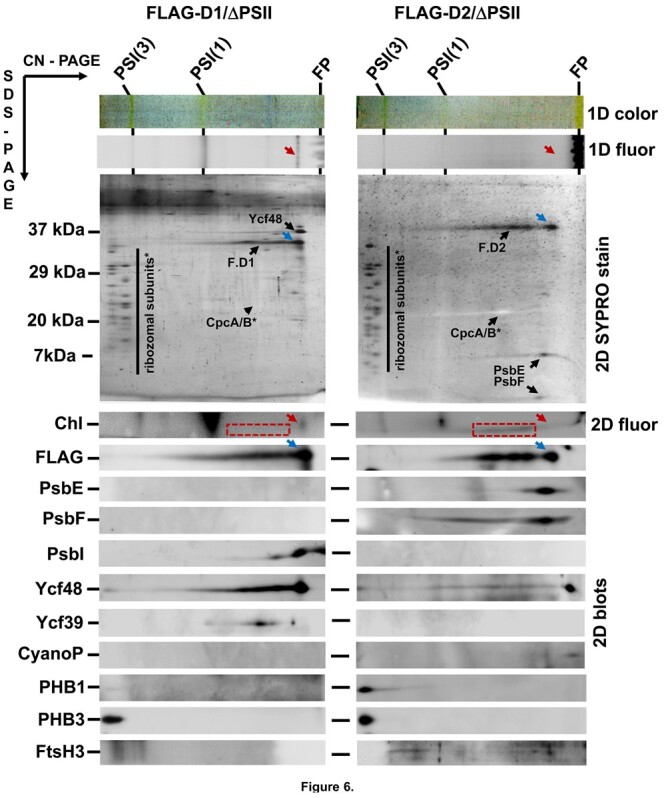
2D protein analysis of FLAG-D1 and FLAG-D2. The preparations were isolated using FLAG affinity chromatography from strains lacking PSII Chl-binding subunits and expressing either FLAG-D1 (FLAG-D1/ΔPSII) or FLAG-D2 (FLAG-D2/ΔPSII). The analysis was performed by CN-PAGE in the first dimension and the native gel photographed (1D color) and scanned by LAS 4000 for fluorescence (1D fluor). Following SDS–PAGE in the second dimension, the gel was scanned for Chl fluorescence (Chl, 2D fluor), then stained by SYPRO Orange (2D SYPRO stain) and probed with the designated antibodies (2D blots). Blue arrows mark the fastest native forms of FLAG-D1 (F.D1) and FLAG-D2 (F.D2) and red arrows their Chl fluorescence signals. Chl fluorescence of slower F.D1 and F.D2 forms is in a red dashed rectangle. FP designates free pigments. Both preparations were isolated from the same amount of cells and the analysis was performed on identical volumes of the obtained preparations.
