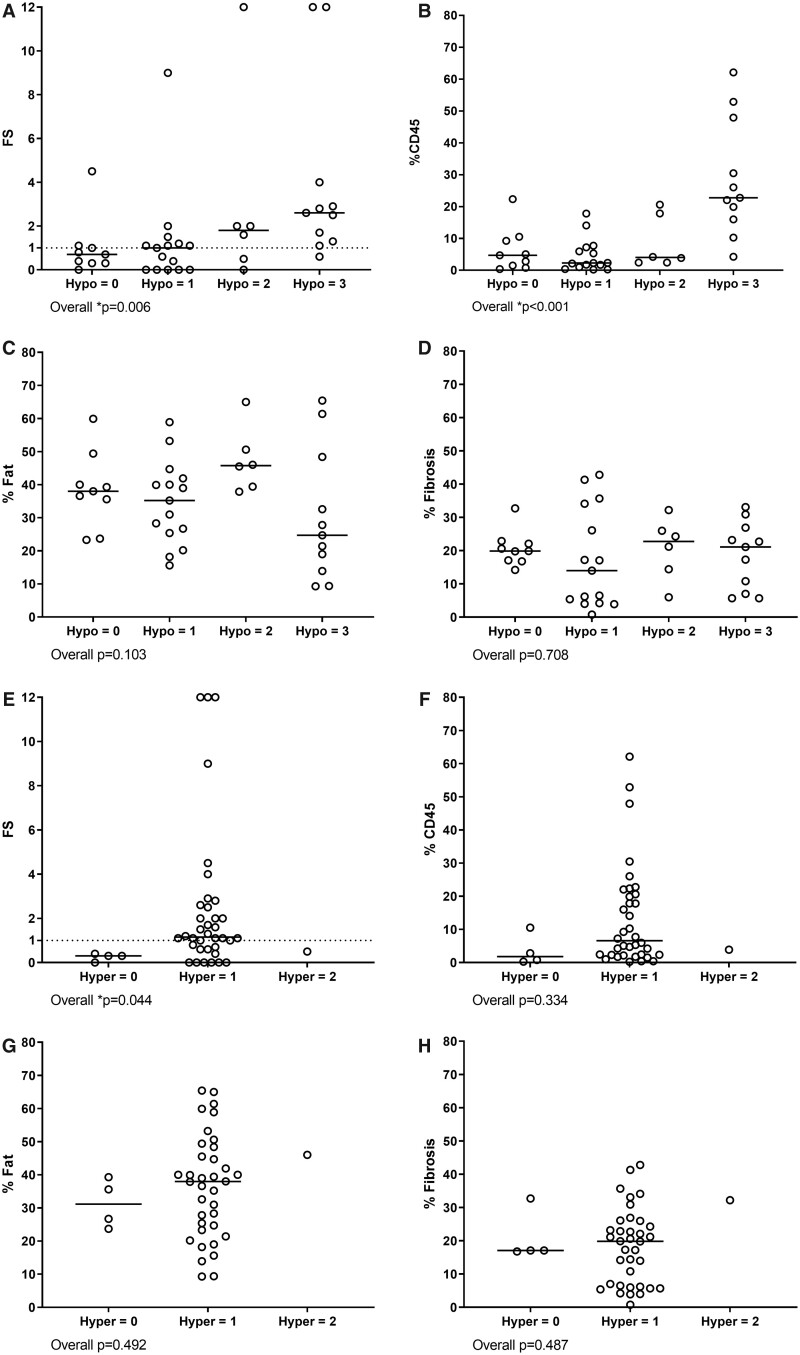
Fig. 2.
Comparison between parotid US and parotid biopsy features
Hypoechogenic areas in the parotid gland compared with (A) the FS, (B) percentage of CD45+ infiltrate, (C) percentage of fat and (D) percentage of fibrosis. Hyperechogenic reflections in the parotid gland compared with (E) the FS, (F) percentage of CD45+ infiltrate, (G) percentage of fat and (H) percentage of fibrosis. Hypoechogenic areas were scored as follows: 0 = absent, 1 = a few (<25%), 2 = several (25–50%) and 3 = numerous (>50%). Hyperechogenic reflections were scored as follows: 0 = absent; 1 = a few, scattered (<25%); 2 = several (25–50%) and 3 = numerous (>50%). Dotted lines represent FS = 1. *P < 0.05.

