Figure 2.
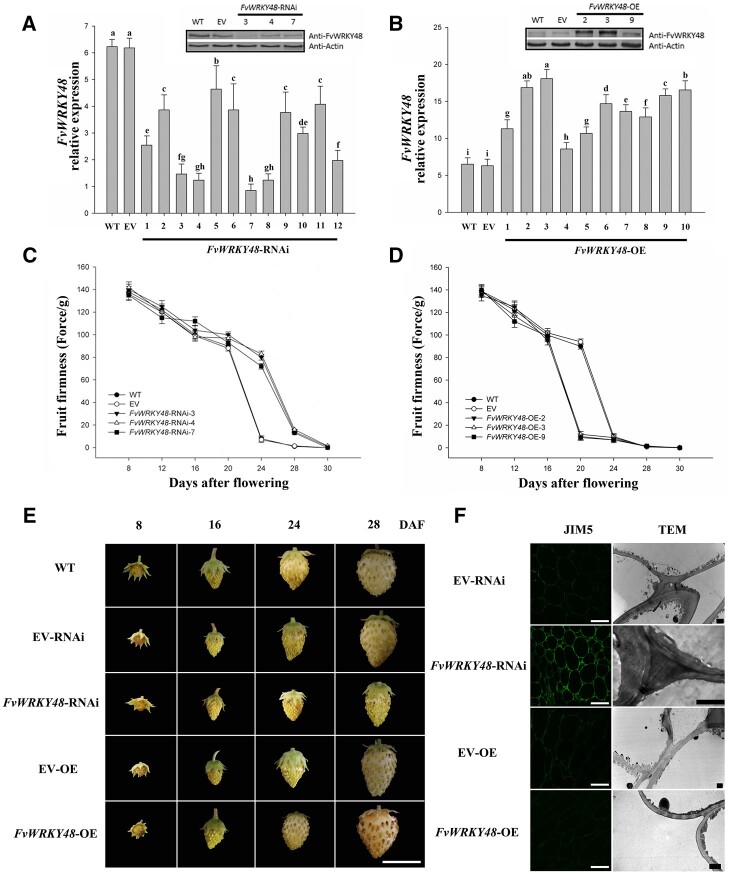
Relative expression and phenotype of FvWRKY48 transgenic lines. A and B, Relative expression of FvWRKY48 in FvWRKY48-RNAi and FvWRKY48-OE fruits in transcript and protein level. Expression levels represent the mean across three biological replicates, error bars represent mean (sd), significant differences (P < 0.05) are indicated by lowercase letters based on Duncan’s test. C and D, Fruit firmness of WT, EV, FvWRKY48-RNAi3, 4, 7, and FvWRKY48-OE2, 3, 9. Values represent the mean across three biological replicates, error bars represent mean (sd) . E, Development of FvWRKY48 transgenic fruit. The development of FvWRKY48-RNAi fruit was delayed. FvWRKY48-OE fruit developed faster than WT fruit or fruit expressing the EV. Scale bar: 1 cm. F, Cell wall structure in the receptacle of FvWRKY48 transgenic lines. The JIM5 antibody was used to recognize de-esterified pectin, scale bar: 50 µm. The scale bar in TEM image represents 2 µm.

