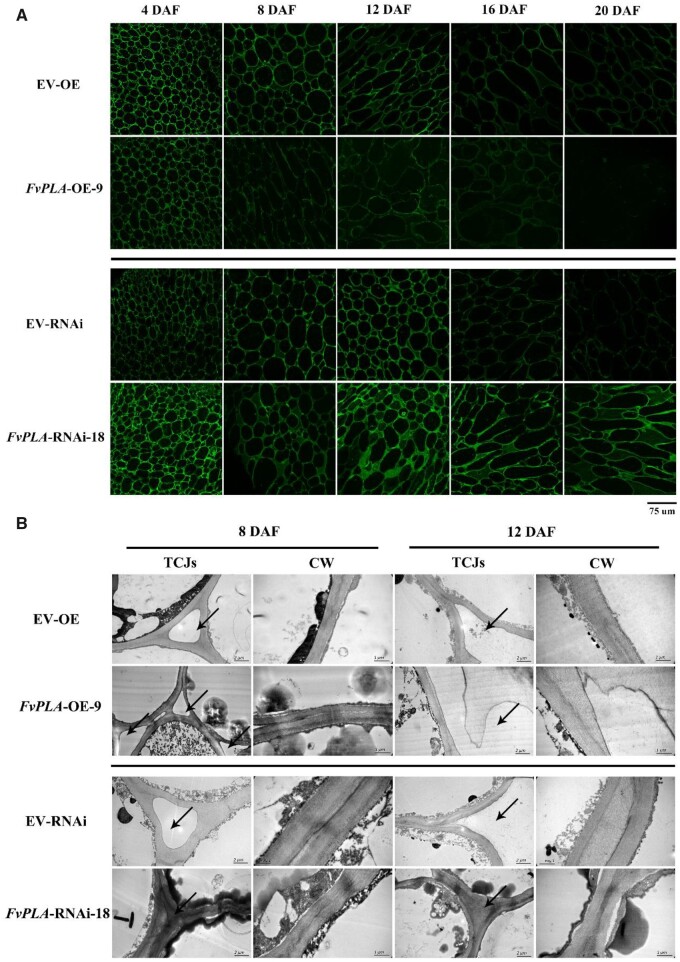
Figure 6.
De-esterified pectin immunolabeling and TEM observation of FvPLA transgenic lines. A, De-esterified pectin immunolabeling of FvPLA-OE and FvPLA-RNAi lines. The signal began to decrease quickly from 8 DAF in the FvPLA-OE line compared with the EV line. The signal was steadily maintained and at a high level in the FvPLA-RNAi line. The scale bar was shown below the graph, scale bar: 75 µm. B, Middle lamella and tricellular junction zones of the FvPLA-OE line were much more degraded than in the EV line, and these zones were denser in the FvPLA-RNAi line. The area indicated by the arrow is the middle lamella, the scale bar of TCJs represent 2 µm, and the scale bar of CW represent 1 µm. CW, Cell wall; TCJs, tricellular junction zones.

