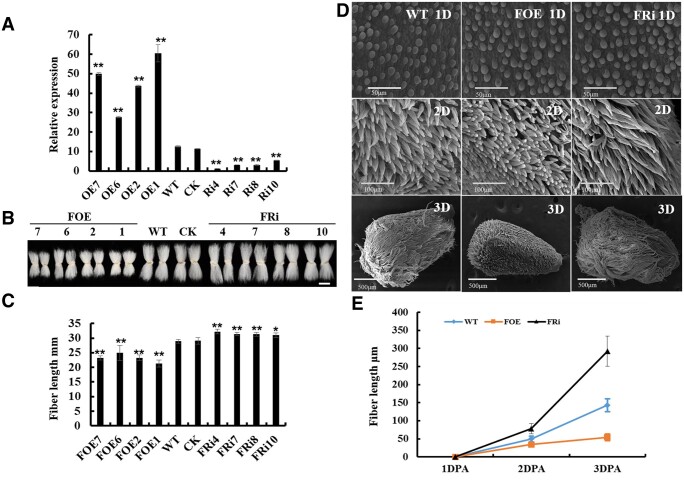
Figure 2.
Phenotypic assay of fibers of GhFP2 transgenic cotton. A, RT-qPCR analysis of GhFP2 expression in fibers of the GhFP2 transgenic cotton plants. Total RNA was isolated from nine DPA fibers of GhFP2 transgenic lines (T2 generation) and WT. Mean values and sd are shown from three biological replicates. GhUBI1 (EU604080) was used as a quantification control. B, Phenotype of mature fibers of GhFP2 transgenic lines (T2 generation) and WT. Scale bar = 2 cm. C, Measurement and statistical analysis of mature fiber length of GhFP2 transgenic lines and WT (n ≥ 50 cotton ovules per line). D, SEM images of the ovules (1–3 DPA) of GhFP2 transgenic lines and WT. 1D, 2D, and 3D refer 1, 2, and 3 DPA ovule with fibers, respectively. Bar = 50 µm in 1D, 100 µm in 2D, and 500 µm in 3D. E, Measurement and statistical analysis of fiber length of GhFP2 transgenic lines and WT at 1–3 DPA (n = 3 ovules per line). Data in A, C, and E were processed with Microsoft Excel, and error bars represent the sd. Independent t tests demonstrated significant (P < 0.05) or very significant (P < 0.01) difference between GhFP2 transgenic lines and WT. DPA, day post-anthesis. CK, the transgenic null line; FOE1–FOE11, GhFP2 overexpression cotton lines; FRi1–FRi10, GhFP2 RNAi cotton lines.

