Figure 4.
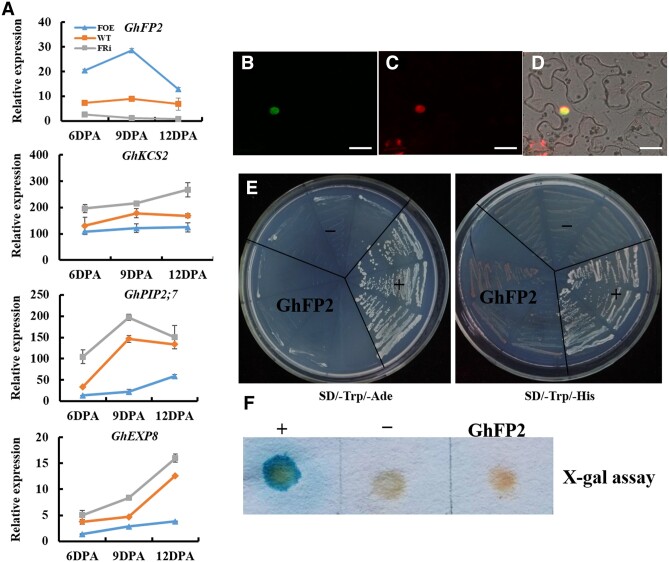
Subcellular localization and transcriptional activity assay of GhFP2 protein. A, RT-qPCR analysis of GhPIP2;7, GhKCS2, and GhEXP8 transcripts in fibers of GhFP2 transgenic cotton lines and WT. GhUBI1 (EU604080) was used as a quantification control. Data were analyzed with Microsoft Excel. Error bars represent the sd. Mean values and sd are shown from three biological replicates. B–D, Subcellular localization of GhFP2 protein. Green fluorescence signals were localized in the nucleus of the GhFP2:eGFP leaf cells. B, Confocal microscopy of GFP fluorescence in cells expressing GhFP2:eGFP. C, Nuclear DAPI staining of the same cells in B. D, Images B and C superimposed over the bright-field image. Bars = 25μm. E and F Transactivation activity assay of GhFP2 proteins in yeast cells. E, Yeast AH109 transformants of GhFP2 were streaked on SD/–Trp/–Ade and SD/–Trp/–His medium. F, Flash-freezing filter assay of the β-galactosidase activity in Yeast Y187 transformants of GhFP2. –, negative control; +, positive control.

