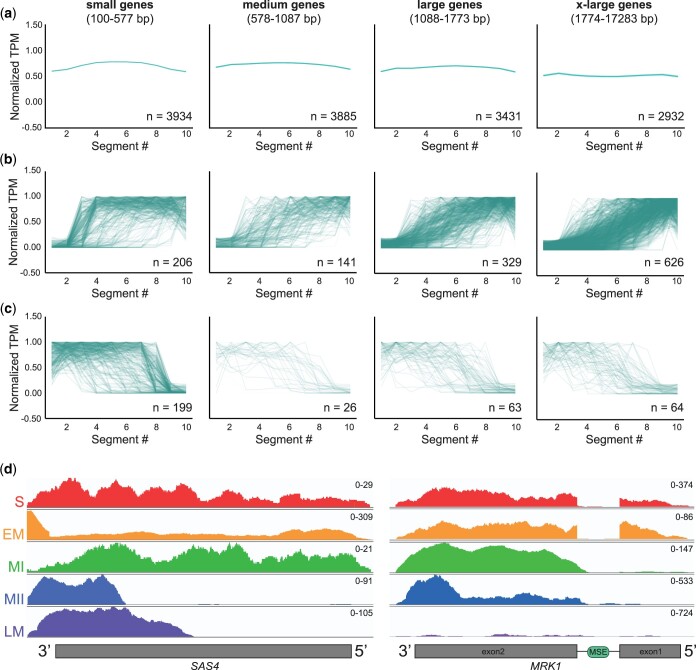
Fig. 3.
Identification of truncated gene isoforms in meiotic cDNA libraries. a) cDNAs with the indicated size range from all libraries were divided into 10 equal segments, the average normalized TPM per segment was plotted, and the average read density for each size quartile is shown. Genes that are present in multiple libraries are plotted multiple times. The number of genes represented by each graph is indicated (n). b) cDNAs from any library that had low TPM in segments 1 and 2 and high TPM in segments 9 and 10 were considered potential 5′-truncations. The normalized TPM per segment are plotted for all 5′-truncations in each size quartile. c) cDNAs from any library that had high TPM in segments 1 and 2 and low TPM in segments 9 and 10 were considered potential 3′-truncations. The normalized TPM per segment are plotted for all 3′-truncations in each size quartile. d) Read density plot for SAS4, which was previously identified as a having a truncated transcript and corresponding protein isoform in meiosis (Brar et al. 2012; Chia et al. 2021), across the 5 yeast cDNA libraries. The y-axis scale for number of reads is found at the top right corner of each plot. S, starvation; EM, early meiosis; MI, meiosis I; MII, meiosis II; LM, late meiosis. e) Read density plot for MRK1, which was previously identified as having a truncated transcript isoform and protein important for meiotic progression (Zhou et al. 2017), across the 5 yeast cDNA libraries as in (d).

