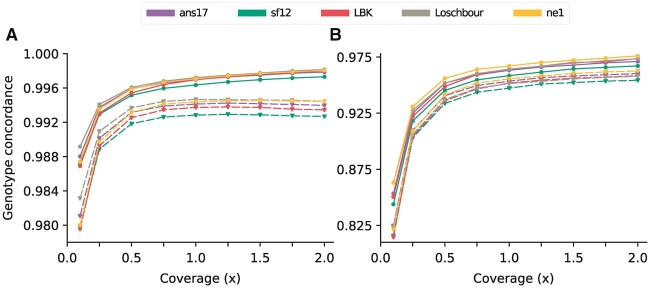
Fig. 3.
Genotype concordance of imputed data for different levels of coverage of the input data, for (A) all markers and (B) markers at which the HQ genotype was heterozygote. Results are shown for the five evaluation individuals, with solid and dashed lines indicating SNPs with and without overlapping reads in the downsampled data, respectively. Imputation was performed using configuration 2 (Table 1), with no filter on posterior genotype probability imposed on the imputed genotypes.

