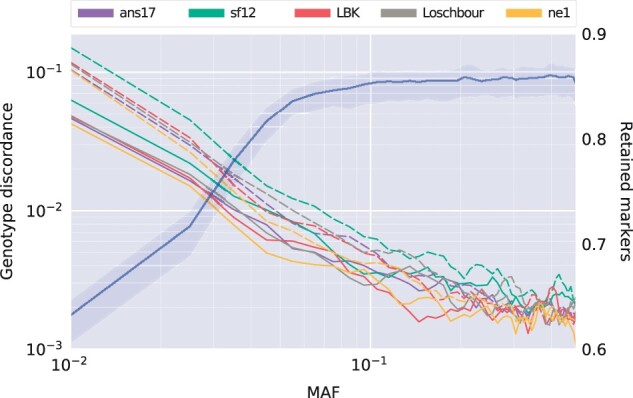
Fig. 6.

Log–log plot of genotype discordance at heterozygote sites, averaged over 50 bins in the allele frequency spectrum and smoothed using a moving average using 3 points. Input data for imputation was downsampled to 1× and configuration 3 (Table 1) was used, after which a posterior filter of minimum genotype probability of 0.99 was applied. The fraction of markers retained after the filter, averaged over the five evaluation individuals, is shown in blue, with shaded regions indicating minimum and maximum. Solid and dashed lines indicate SNPs with and without overlapping reads in the downsampled data, respectively.
