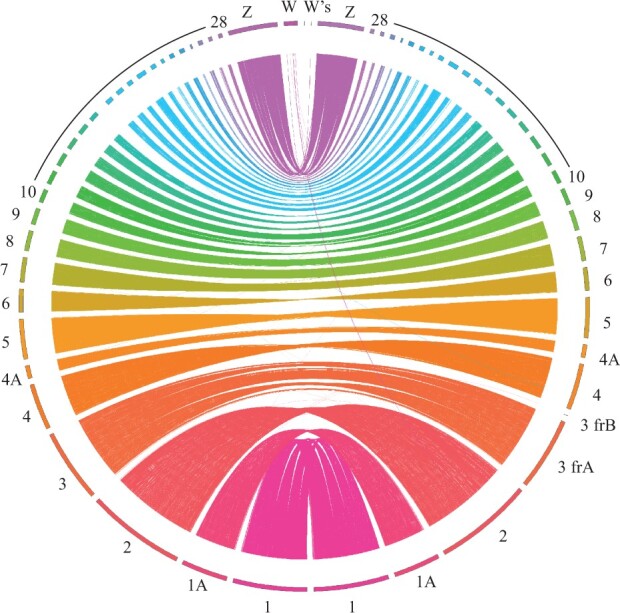
Fig. 2.

Circos plot showing synteny patterns between the zebra finch (left hemisphere) and the dark-eyed junco (right hemisphere) genome assemblies. Chromosome 3 is represented by 2 scaffolds (frA and frB). Only the 2 largest scaffolds of the 293 that mapped against the W chromosome are shown.
