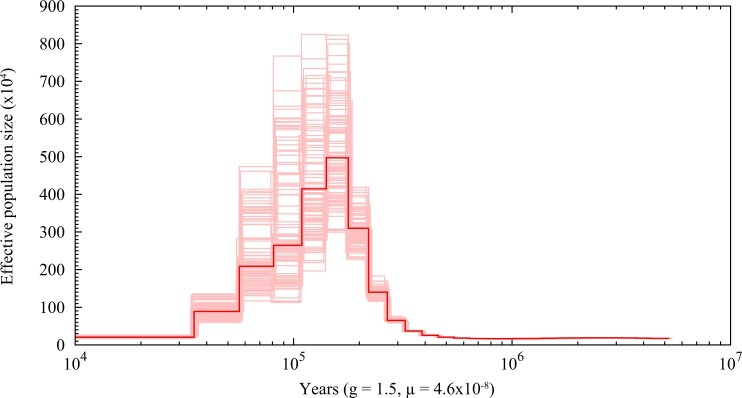
Fig. 3.
Changes in the ancestral effective population size of the dark-eyed junco. The dark red line represents the original effective population size through time, and light red lines represent 100 bootstrap estimates. The indices g and µ denote the generation time and the mutation rate, respectively.

