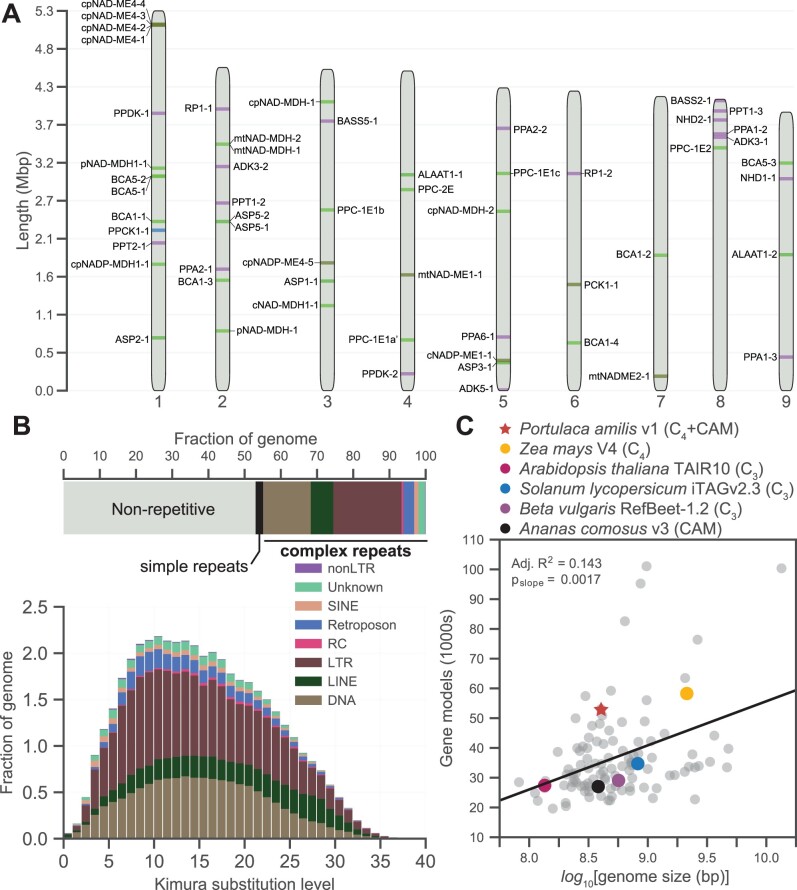
Figure 2.
Genome and genomic content of P. amilis. Idiogram of the nine primary scaffolds of the P. amilis genome with key C4 and CAM genes highlighted (A). Breakdown of repetitive elements (B); the horizontal bar chart shows the fractions of major classes of repetitive elements and the repeat landscape (histogram) shows the relative abundances of repetitive elements versus the Kimura substitution level from the consensus. Scatterplot of number of gene models versus the log10-transformed genome size for 107 angiosperm genomes (C) with notable benchmarking and CCM genomes highlighted; data are from Zhao and Schranz (2019). Line in (C) shows results of ordinary least squares regression; one sample tslope (106) > 0, pslope = 0.0017.

