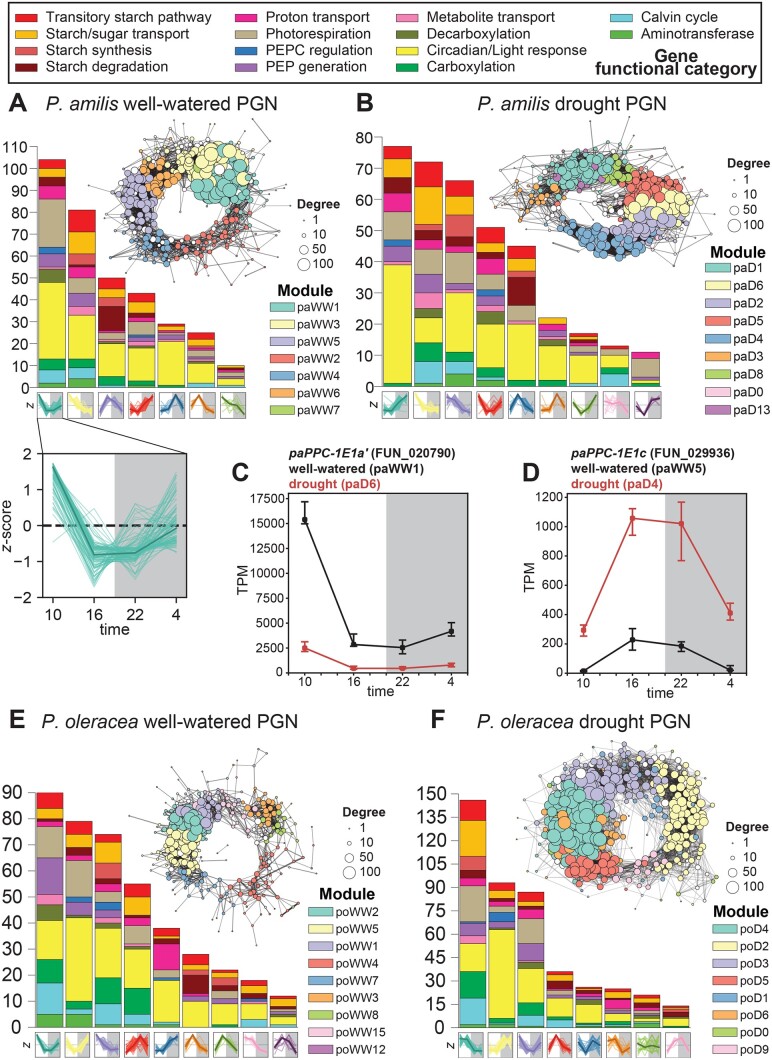
Figure 3.
PGNs. Well-watered and drought PGNs of P. amilis (A and B), and P. oleracea (E and F) colored by WGCNA co-expression module identity. Each node in the graph represents one gene and node sizes represent their degrees. Each module’s size and functional composition are shown in the histogram, and the z-score normalized expression of each module’s constituent genes is shown along the horizontal axis. An example of the z-score normalized expression for module paWW1 is enlarged in (A) to show individual gene expression with the median highlighted in bold. TPM normalized expression profiles of two focal PPC transcripts (PaPPC-1E1a’ and PaPPC-1E1c) are shown in (C) and (D), respectively; points show median of six biological replicates and error bars show interquartile range; black and red lines represent well-watered and drought samples, respectively.

