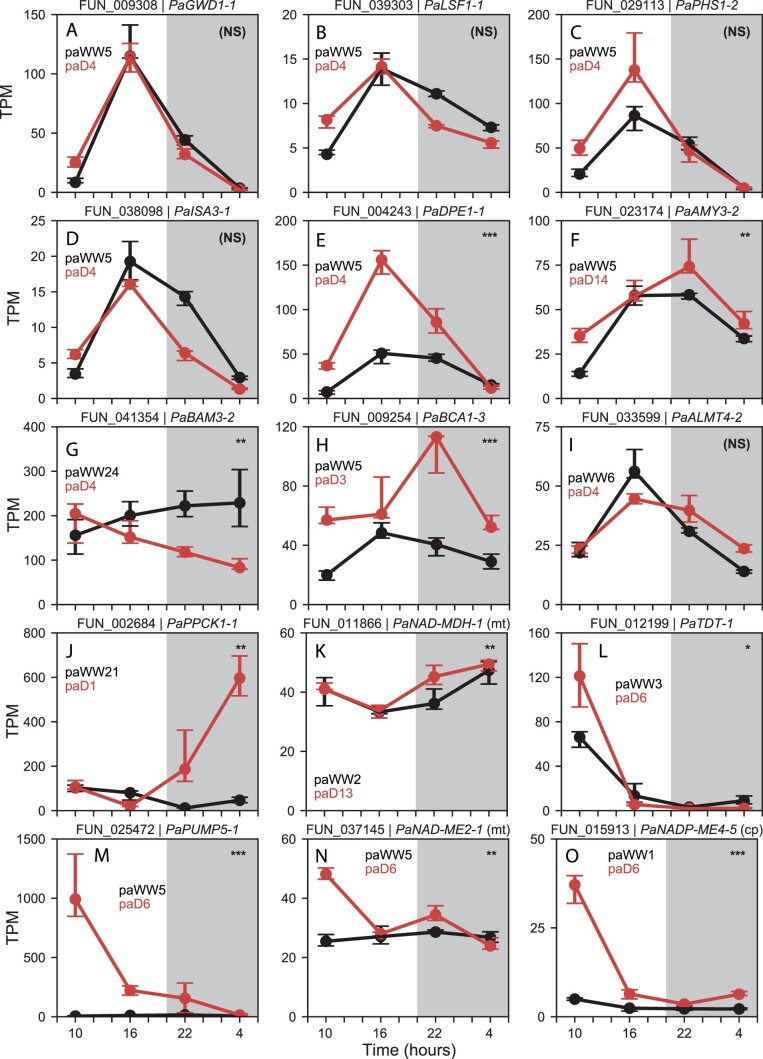
Figure 4.
TPM normalized abundance of selected P. amilis genes hypothesized to be involved in CAM. Gene model and name are shown above each plot, and black and red lines show median well-watered and drought abundance of all biological replicates (n = 6), respectively; error bars show interquartile range. Module assignments are listed for well-watered and drought networks in black and red, respectively. (A) GWD, glucan water dikinase; (B) LSF, phosphoglucan phosphatase; (C) PHS; (D) ISA, isoamylase; (E) DPE, 4-alpha-glucanotransferase; (F) AMY; (G) BAM, beta-amylase; (H) BCA; (I) ALMT, aluminum-activated malate transporter; (J) PPCK, PEPC kinase; (K) NAD-MDH; (L) TDT; (M) PUMP, mitochondrial uncoupling protein/dicarboxylate carrier; (N) NAD-ME, NAD-dependent ME; (O) NADP-ME, NADP-dependent ME. Significant differences in abundance across each time series between well-watered and drought conditions are shown in the upper right corner of each plot. P-values for unique transcripts were aggregated for each gene model and transformed into q-values by adjusting for false discovery rate (see “Materials and methods”); “NS” = nonsignificant, “*” = q < 0.05, “**” = q < 0.01, “***” = q < 0.001.

