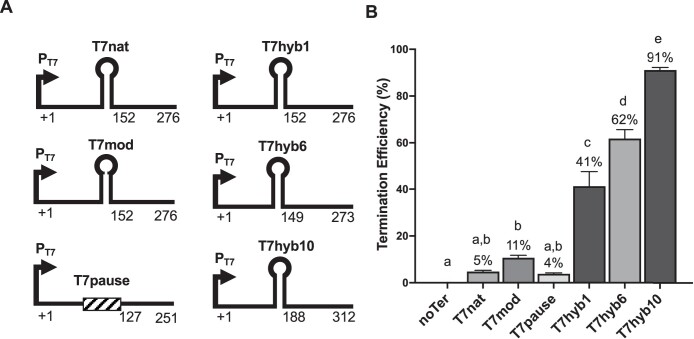
Fig. 2.
Performance of selected terminators in vitro. a) Diagram of transcription templates for in vitro testing using recombinant T7RNAP. The 3 numbers underneath each diagram show the transcription initiation site, the predicted site of termination, and the length of the run-off product. Hairpin symbols represent the cloned T7 terminators. b) In vitro termination efficiency of selected terminators. The error bars represent standard deviation from the mean. Different letters denote statistically significant differences (P < 0.05) according to a Tukey multiple comparison test.

